EUR/GBP Long-Term Analysis: Bullish
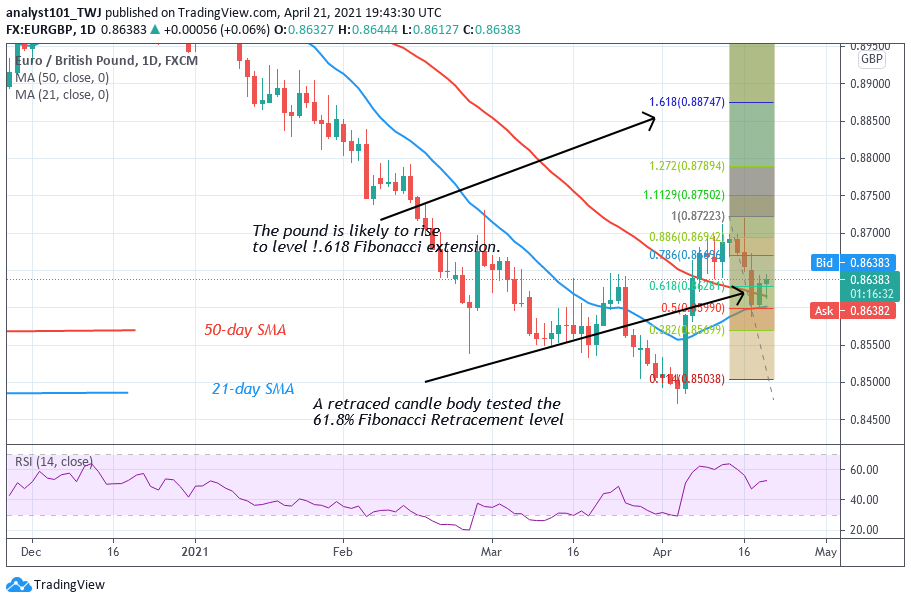
EUR/GBP pair is recovering from the downtrend after falling to the low of level 0.8500. The currency pair rebounded above level 0.8500 to reach the high of level 0.8700. The Pound was resisted at the recent high and the pair pulled back. The price movement has a brief uptrend. On April 14 uptrend, a retraced candle body tested the 61.8% Fibonacci retracement. The retracement indicates that the pair may perhaps move up to level 1.618 Fibonacci extension or level 0.8874.
EUR/GBP Indicator Analysis
The currency pair price is above the 21-day and 50-day SMAs which suggests a further rise in price. The moving averages are pointing northward indicating the uptrend. The Pound is at level 52 of the Relative Strength Index period 14. It indicates that it is in the uptrend zone and capable of rising on the upside. The pair is in a bullish momentum above 40% range of the daily of daily stochastic.

Technical indicators:
Major Resistance Levels – 0.9200, 0.9300, 0.9400
Major Support Levels – 0.8500, 0.8400, 0.8300
What Is the Next Direction for EUR/GBP)?
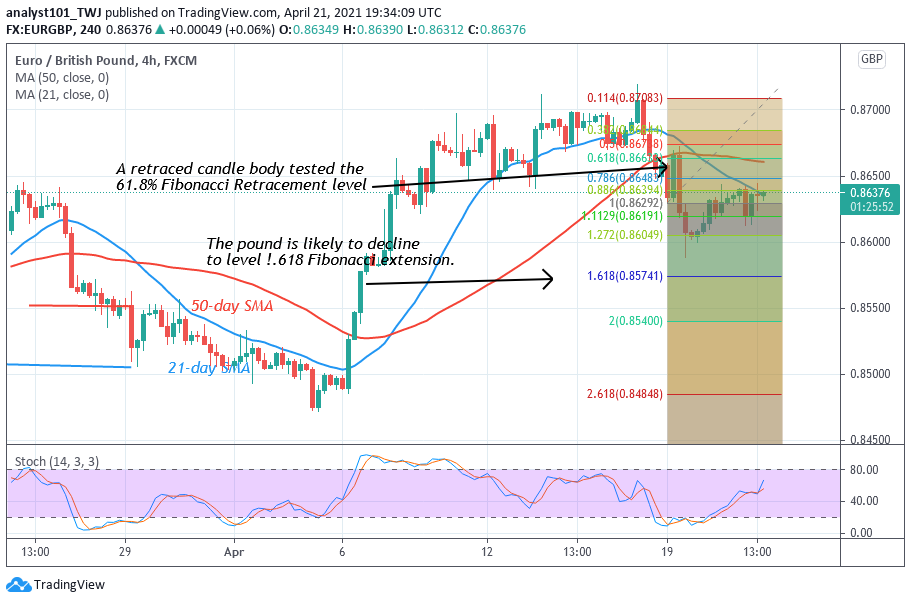
The Pound is likely to move up after a minor retracement. On the 4 Hour Chart, the pair was in a sideways move below level 0.8700 resistance zone. Buyers could not breach the resistance level. On April 19 downtrend a retraced candle body tested the 61.8% Fibonacci retracement. This retracement also indicates that the pair will fall to level 1.618 Fibonacci extension or the low of level 0.857. From the price action, the pair fell to level 0.858 and pulled upward.

Note: Forexschoolonline.com is not a financial advisor. Do your research before investing your funds in any financial asset or presented product or event. We are not responsible for your investing results


Leave a Reply