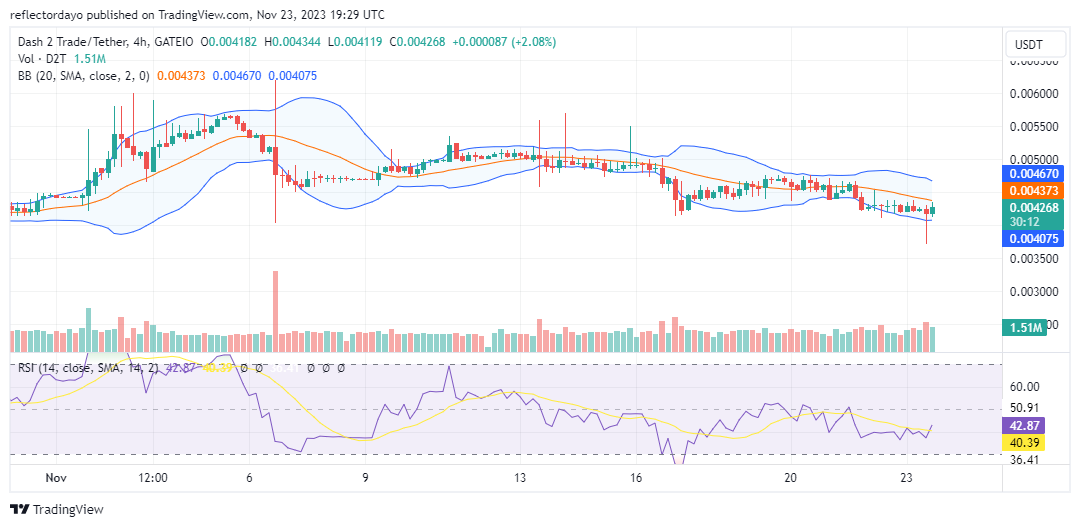
The price level of $0.0042 served as pivotal support during the recent Dash 2 Trade bullish surge, propelling the market to a high of $0.0062 on November 6. Presently, bearish pressure has retraced the market to the support level, leading to a sideways consolidation along this key level. The latest market development, indicated by a hammer candlestick, suggests a potential resurgence in bullish momentum, hinting at a potential rally towards the $0.0062 price level.
Key Levels
- Resistance: $0.010, $0.011, and $0.012.
- Support: $0.004, $0.003, and $0.002.
Dash 2 Trade (D2TUSD) Price Analysis: The Indicators’ Point of View
In the recent 4-hour session, a hammer candlestick emerged on the chart, indicating a rejection of bearish prices below the $0.0042 level. This bullish signal suggests that despite the ongoing sideways movement around this price level, attributed to the ongoing struggle between bulls and bears in the Dash 2 Trade market, there is a potential for an upward market movement. While current indicators still reflect a bearish trend, the formation of the hammer candlestick in the preceding 4-hour session hints at the possibility of an imminent price rally.
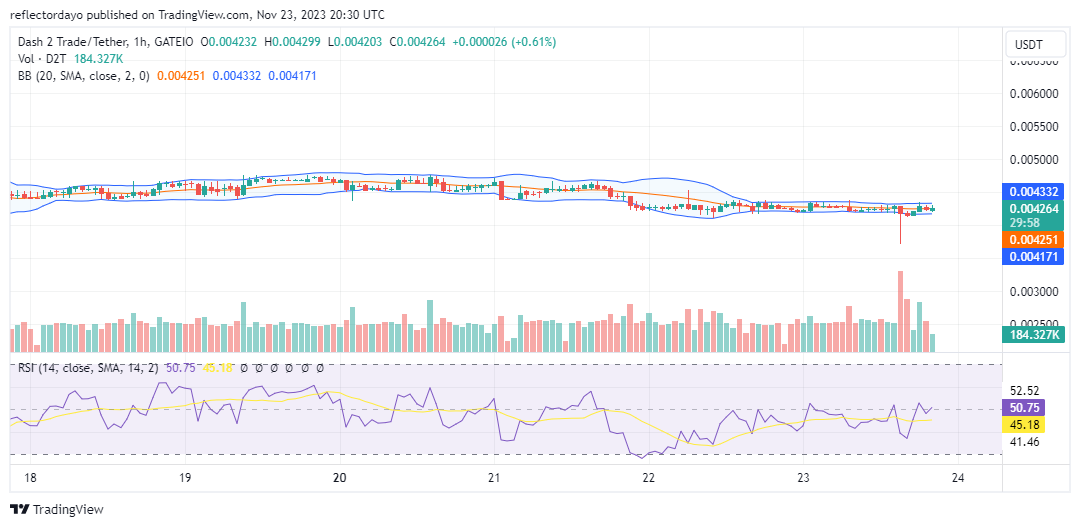
D2T/USD Short-Term Outlook: 1-Hour Chart
Examining the 1-hour chart perspective of the market, the Bollinger Bands indicate an unusually narrow price channel, notwithstanding the notable trade volume in the preceding session. The Relative Strength Index currently depicts a market in equilibrium, reflecting a standoff between bulls and bears. Traders should vigilantly monitor price movements, particularly if there is a breakout above the upper resistance level, as it could signal the initiation of a bullish cycle.
What a busy week the cryptocurrency world had! After a little decline, Bitcoin turned green once more, indicating strong bullish signals.
🚀 Smart Money Insights 📊
What an eventful week in the crypto realm! Bitcoin took a brief dip, then turned green again, signaling strong bullish indicators.
📉 Market Moves & Regulatory Signals: Recent SEC actions aim more at control than destruction of crypto. Institutions… pic.twitter.com/EC15T42sqH
— Dash 2 Trade (@dash2_trade) November 23, 2023
Do you want a coin with great potential for enormous returns? Dash 2 Trade (D2T) is that coin. Buy D2T now!

Leave a Reply