Change MT4 Time Frame With Free Period Converter Indicator
Metatrader 4 (MT4) charts are the top of industry standard charting platform used widely with most Forex brokers.
MT4 offers a fantastic platform that is both easy to use and quick to pick up and learn, but whilst there are many time frames in-built to the standard MT4 stock platform, one of the drawbacks is that some of the other time frames that traders would really like to trade are not easily available with the in-built platform.
Time frames such as 2hr, 8hr or 2 day which are really quality time frames, especially for price action traders are not available and having these time frames as an option would make a big bonus and open up a lot more potential trading opportunities in the same markets already being traded.
Changing MT4 Candle Time Frame
To fix this problem traders can use an indicator or EA that is simply installed into their MT4 platform which allows traders to change the time frame into anything they would like.
This indicator works by allowing the trader to go into their charts and open an “off-line” chart. This new chart is not actually off-line and it is very important that this point is made.
For as long as the trader continues to keep the original indicator running, the new off-line chart will continue to update just like any other real live time chart even though it says it is off-line.
As soon as the trader closes the indicator on the original chart, it does not matter if the new time frame chart is open or not, it will stop updating because the indicator has been closed.
How to Download the Period Converter Indicator
Since the update of MT4 to build 600, there is a new way to upload indicators.
Previously indicators were uploaded by saving them straight to the MT4’s indicator file, however it is done slightly different now so please follow the instructions below carefully and if you have any questions, then please put them in the comments below with a correct email address so you will be notified when you receive a reply and also so that if I need to send you a longer reply I can just email it to you (your email address is not published on the website).
Important Note: Make sure you are using the correct New York Close 5 Day Charts. If you are unsure what these are or if you need to download a free demo platform see here; Using the Correct New York Close 5 Day MT4 Price Action Charts
1: First; save the Change Time Frame indicator to your computer . When you click on the link it will ask you where you want to save it and you just need to save it to somewhere on your computer where you can get to it easily.
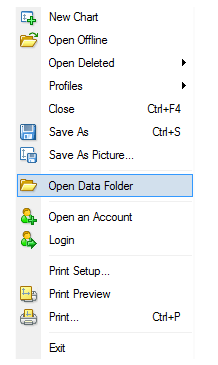
2: Open your MT4 platform and hit the “file”, then “Open Data Folder” button as the picture shows below;
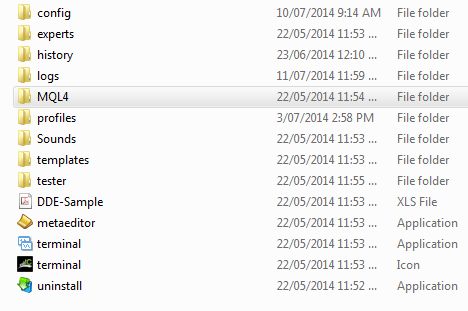
3: This will open up your MT4’s files on your computer. Leave these open as you will come back to them shortly. You need to then go to where you saved the Change Time Frame Indicator on your computer. The indicator will be called “P4L_PeriodCon (1).ex4”. Click on this indicator, then right click and copy it.
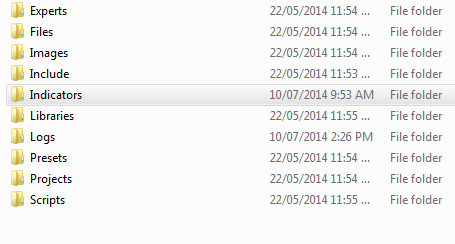
4: Go back to the open MT4’s files. In here click on the MQL4 file and then click into the indicators file. This is where all the indicators are stored for MT4 as the third picture below shows.
NOTE: Some MT4’s will only have a MLQ4 file and will not have an indicators to then click into. Don’t worry if there is no indicators file. See pictures below;
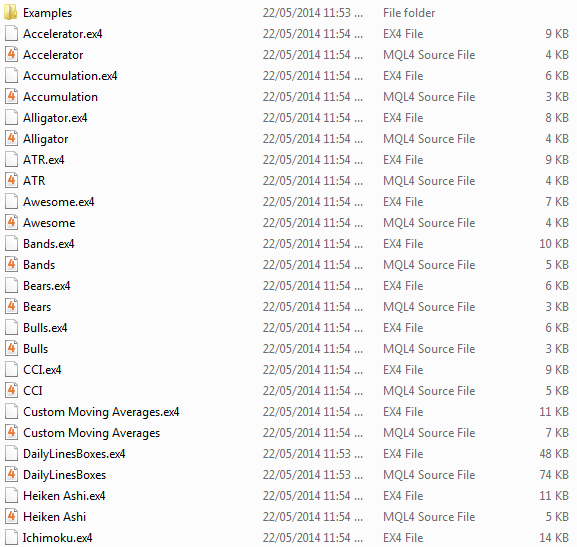
5: Once in the indicators file, right click and paste the indicator with the rest of the other indicators. This will paste the new indicator into MT4.
6: You will now need to close and re-open your MT4 for this new indicator to appear in your indicator files.
7: Your new Change Time Frame Indicator is working and this is now how all new indicator uploads will work for MT4.
How to Use the Change Time Frames Indicator
Using the Time Change Indicator is quite simple once you know how, but there is a learning curve like most things. After following the above instructions to upload the new indicator, please make sure you close and re-open your MT4 so it is ready to use.
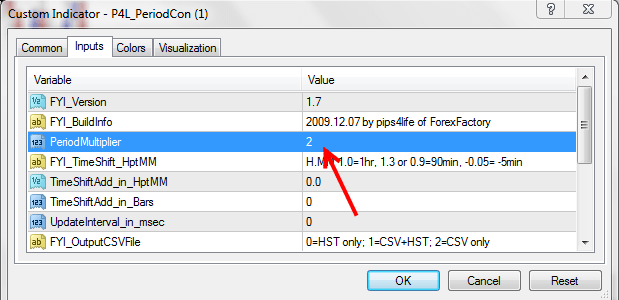
1: Now that your MT4 has been re-opened you need to decide what time frame you wish to change because in the indicator under the “inputs” and “Period Multiplier” section you will determine the time frame of the chart.
For example; if you open a 1hr chart and in the period multiplier section you put a 2 this will make a 2hr chart because 2 x 1hr = 2hr. If you opened a 1 day chart and put 3 in the period multiplier section, then you would come out with a 3 day chart because 1 day x 3 = 3 days. Of course there are other ways to get the same charts.
For example; to get a 2 day chart you could either open a 1 day chart and put 2 in the period multiplier section to make a 2 day chart or you could open a 1hr chart and put 48 in the period multiplier because both would make a 2 day chart.
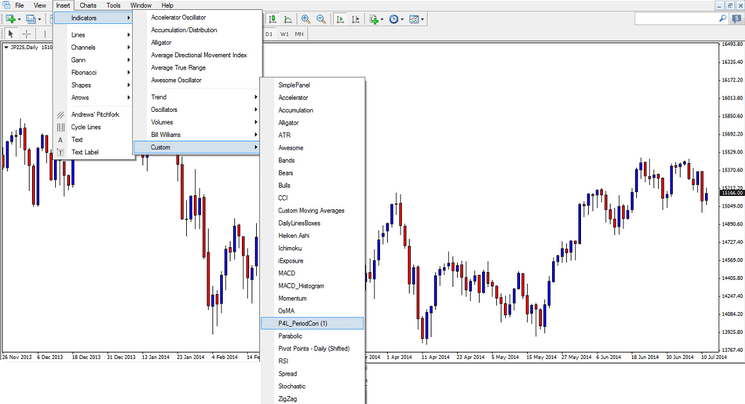
2: Now that you have chosen the pair and time frame you wish to make, in your MT4 platform select; “Insert” – “Indicators” – “Custom” and then the Time Change Indicator which will be called “P4L_PeriodCon (1)” just as the picture shows below;
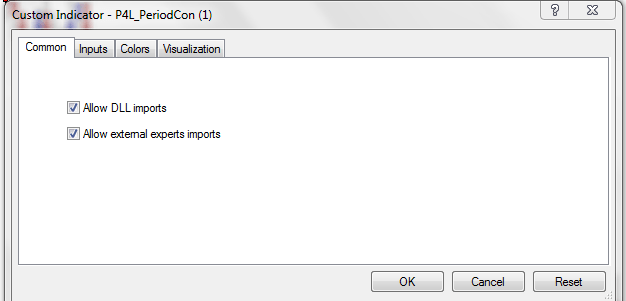
3: With the indicator open please first make sure that under the “Common” box that “Allow DLL imports” is ticked as the picture shows below;
4: Under the “Inputs” and then in the “Period Multiplier” section please input the number to make the time frame you wish to form as explained above in point one. Once done click “Okay”. The picture shows this below;
5: To open your new time frame chart click the MT4’s; “File” – “Open Off-line”. This will open all your off-line charts. Please select the new time frame chart that you have just created.
As explained previously in this article; this new off-line chart is NOT off-line and will continue to update for as long as you do not go back to the original chart that you added the indicator to and delete it. As soon as you delete the indicator the new time frame will stop updating.
6: You are free to do as you would normally do with your other charts such as change the colours and add levels etc., One thing you cannot do is go into the chart properties and take the chart from being an offline chart. This chart is set to being offline and it will continue to update and work as normal whilst the indicator is running and it is set to off-line so make sure you do not take this setting off.
Making the Very Most of the Change Time Frame Indicator
With this indicator pretty much any time frame chart can be created, but that is not to say that any chart should be created.
Traders need to think about how they should use this tool. Just because traders can all of a sudden start trading a heap more charts with this indicator, does not necessarily mean that they should be.
Traders need to be super smart about how they go about using this indicator and their approach to the markets and understand that more time frames can either help a trader who has discipline and is hunting the best trades or really hurt a trader who is using it as another way to make far too many trades and as a way of over-trading.
As I discuss in the trading lesson The Ultimate Guide to Price Action Support & Resistance traders need to think wisely about how they set up their charts and use their time.
Traders should not be going through every single pair at the 4hr candles  close looking to see if a price action signal has formed and, then again the 8hr charts to see if a price action signal has formed because not only does this take up a huge amount of time, but once a trader does find a signal, they then have to work out if that trigger signal is from a key level anyway.
What traders are far better of doing that optimises their time and can really put this indicator to the best of it’s potential use is first marking up their charts with their key levels.
When price then moves into a key level that the trader wants to make a trade from, the trader then starts to hunt for trades on their charts.
This is when the trader can start clicking through their 4hr charts and using the indicator to make an 8hr chart to see if there is a high probability trigger signal at the key daily level.
This cuts down a huge amount of wasted time where traders are going through chart after chart where price is nowhere near a key trading level and it also ensures that when traders are hunting for high probability trigger signals, they are hunting for them from really key levels that have already been pre-marked.
Recap
With this indicator you have the ability to make any time frame you want, but you must also realise that whilst this indicator now opens up a lot more trading opportunities and time frames, the market is not there to be sucked into and to be stared at all day long.
Traders need to be in and out when the best opportunities arise at their key levels, rather than just making random extra time frames and looking for excuses to make any trade.
If you have any questions or want any help with getting the indicator working or anything at all just post it below in the comments box. I would also love to hear your comments in the comments section below.
Safe trading,
Johnathon
Related Forex Trading Education & Articles
Using the Correct New York Close 5 Day Charts
Daily Trading Routine of Forex & Futures Trader Johnathon Fox

Hello Jonathan,
I just open a demo account with IC markets, kindly help to send the Mt4 period time converter.
Hi Michael,
please use the download link in this lesson and it will be sent to you.
Anything else just let us know.
Will the free time convertor give a 2 minute chart
Hi Tony,
yes. You can convert any time frame from 1 minute onward. For example; turn 1 minute time frame into 2 minutes, 1 hour into 2 hour, 1 day into 2 day etc (basically any time frame).
Johnathon
Thank Johnathan
Hello Johnathan
I just want to know how to delete the indicator on an original pair that I have added the indicator on it?
Senzo
Hi Senzo,
go to the pair you added it to, right click with mouse, hit indicators, click on the indicator you want to delete and then delete.
Any questions let me know,
Johnathon
Hello Jonathan,
I got the indicator downloaded but as I am using Mac i had to follow a different way to paste it in indicators folder, guess whether is that the reson its not working.
I even restarted the system but the indicator does not show in the customs area. Fyi I m using a demo account currently on Axitrader.
Please let me have the step by step guide to let it work on my mac as I am a serious trader following strictly your procedures since they are quite convincing and logically fool proof.
Hi Lata,
if you have the indicator in the wrong spot, then that will definitely be the issue. Rebooting the PC is not going to change anything or make anything appear if it is not where it needs to be.
I recommend you download a free demo from one of our recommended brokers that use MT4 charts specially designed just for Mac users so that you do not have to download or use any expensive crossover software. You can download a free demo here; https://www.forexschoolonline.com//recommended-forex-broker-charts-price-action-traders/
The instructions you need to follow once this Mac MT4 is installed are as follows;
Step 1
Download and save your Expert Advisor (EA) to your Apple Mac. Please ensure to remember the download location.
Step 2
Select “Finder”
Step 3
Select “Applications”
Step 4
Right click on “Show Package Contents”
Step 5
Select “drive_c” then “Program Files” then “IC Markets Trader” then select “experts”
Step 6
Copy your “ex4” and “mq4” files into the experts directory
Step 7
Open your IC Markets MT4 for Apple Mac Installation and you will be able to see your Indicator in the Navigator menu
Please note; these instructions are for downloading and using an indicator. If you go and use an EA such as the Forex School Online Break Even Indicator you will need to save it to a different folder because indicators and Expert Advisors (EA’s) are different.
Safe trading,
Johnathon
Hello johnathan
I want to know if I place a trade on the offline chart then switch my computer off then came later my trade will still be on like in normal time frame?
Senzo
Save/Download the Change Time Frame Indicator.
Dear Sir,
I try to download and installed for Step 1.
But i can’t download the file and the following error message shown’
“Windows can’t open this file”
Thanks.
Alex.
Hello Alex,
the indicator is made for MT4 only and not window/mac etc. You cannot open in windows as it is now made for it.
Please follow step one exactly and save the indicator on your computer. It does not matter where you save it you just need to save it so that you can come back to it. If clicking the link is not working, then try right clicking with your mouse and hitting the “Save As” option to save where you want to on your computer.
Then follow the rest of the steps to transfer into your folders.
Johnathon
Hi, Johnathon.
I noticed a bug about this indicator or maybe it isn’t a bug…
There is no problem for creating timeframes such as 2Hour,8Hour, 12hour. But when we try to create a 2Day timeframe there are times when we need to blend a Friday bar with the next Monday bar. And this indicator never blends them, they appear as two separate bars on 2Day timeframe.
So this isn’t a truly 2Day timeframe in my opinion. What do you think? Can this cause trouble when we interpret the price action on 2Day charts created by this indicator?
Best regards
Yoseph
Hello Yoseph,
the problem is that we don’t get to pick what two candles we would like to blend together. Obviously not every candle can be blended with every candle. It could be if the indicator allowed us to choose, but it does not have this function and so it automatically is just set to blend. This means that you will not be able to blend all candles will other candles because you don’t get a choice what gets blended.
This is exactly the same for the intraday charts on the 2 hour, 6 hour, 8 hour etc. We don’t get to choose what candles blend together.
You need to keep in mind that what this indicator is for and why we use it. As price action traders we are concerned about the price action and the whole chart and the price and this can be read and interpreted on all time frames. The order flow and price action information can be read from all the different time frames and the reason we are using this indicator is just to see if we can find that confirmation trigger signal if and when price has moved into one of our key trading levels we are hunting for a trade.
Safe trading,
Johnathon
Hi, please let me know if there is something to change the time frames of all open charts to 5/15/30/etc with one click .
Cheers
Marty
Hello Marty,
not sure I understand your question.
there is nothing that can be done with one click that I know of for MT4 at this point it time for new time frames that are not built into MT4, but the time frames you are asking for 5/15/30 min are all in-built and they can all be accessed with one click already already by hitting selected time frame from the time frame selector bar near the tools section.
If I have misunderstood your question please let me know,
Johnathon
Figured it out…Selected “false” under “limited alerts enabled” in the indicator inputs and it stopped : ) Regards
Hello Deirdre,
please make sure that once you turn that “limited alerts enabled” off for that indicator that the time frame chart you have created does not stop updating. I am pretty certain what you will find is that once you turn that alert off, you will no longer get the alert, but your new time frame will not update as a live chart anymore.
You should only be getting an alert when you go to change the time frame that the indicator has been placed in i,e if you have created a 8hr EURUSD by putting the indicator on the 4hr EURUSD chart, then you should only get the alert when you go back to change that original 4hr EURUSD time frame.
I am not sure how you are using the indicator, but the way I personally use it is that I only go looking for setups and only change time frames to make other time frames when price is at a key level.Other than that I have stock standard charts and am just flicking through my daily charts looking for price to move into key areas with no different time frames setup and obviously no alerts. I discuss how I do this and why it saves a heck of a lot of time here: https://www.forexschoolonline.com//ultimate-guide-marking-support-resistance-price-action-charts/
Safe trading,
Johnathon
Hi Johnathon, thanks for this post. I tried it and keep getting alerts each time I switch to another pair or timeframe. How do I turn off the popup alerts? It’s quite annoying.
Regards,
Dee
Hi Johnathon, I have tried this ,but when I open it ,it show H32 instead of 8 hours which gives
me the wrong hours on my chart
Regards
Limbo
Hello Limbo,
if you are coming up with a 32hr chart you maybe adding the indicator to a 4hr chart ( 8 x 4hr chart = 32 hrs).
Please make sure that the chart you are adding the indicator to is a 1hr chart and you then put “8” in the period multiplier section (8 x 1hr chart = 1hr chart).
Any other questions or still don’t have any luck please let me know.
Johnathon