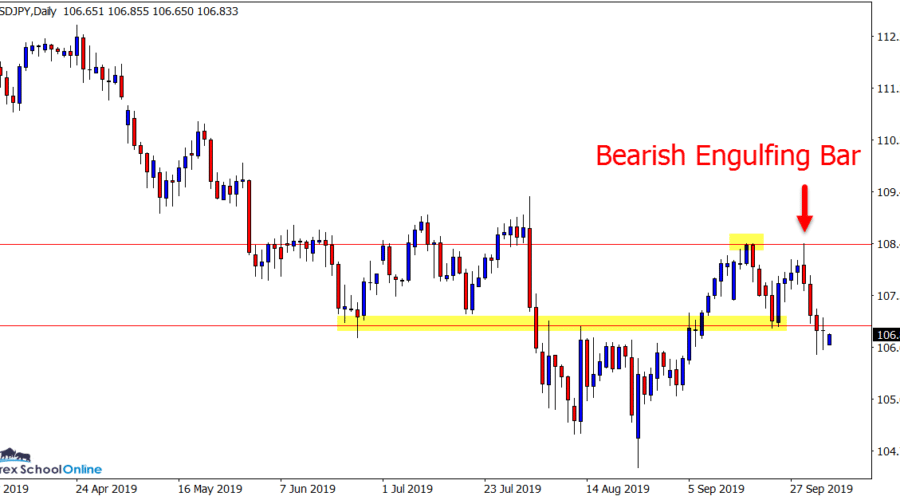
Weekly Price Action Trade Ideas – 13th to 18th Oct 2019 Markets Discussed in This Week’s Trade Ideas: GBPUSD, USDJPY, AUDUSD and EURGBP. Note: We Use Correct ‘New York Close 5 Day Charts’ – You can read about why we use these and how to download the correct free charts at Correct Free …
Price Action Charts in Focus
Forex School Online Review
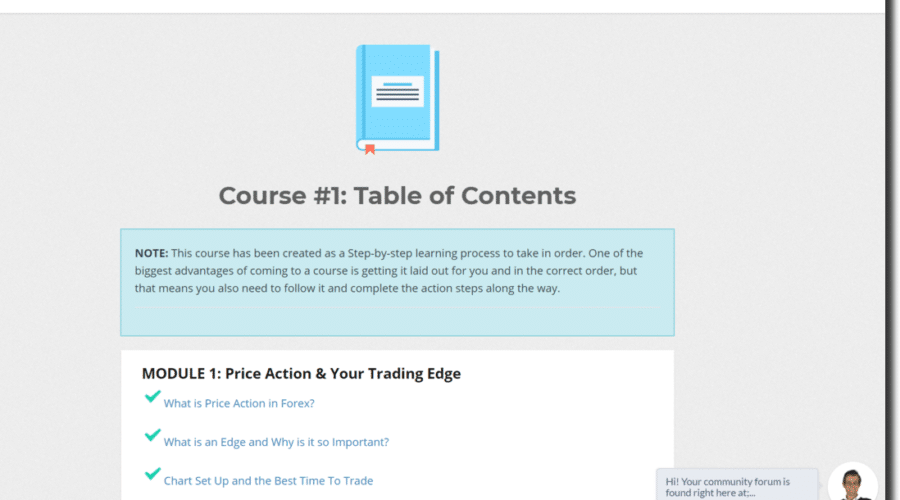
Forex School Online Review- What Exactly Do You Get? When you join Forex School Online you are joining much more than just a web site or another 'one-off' course. The "Transform Your Trading With Price Action Trading Course" is designed to be the last course you ever study and take in your …
Weekly Price Action Trade Ideas – 7th to 11th Oct 2019
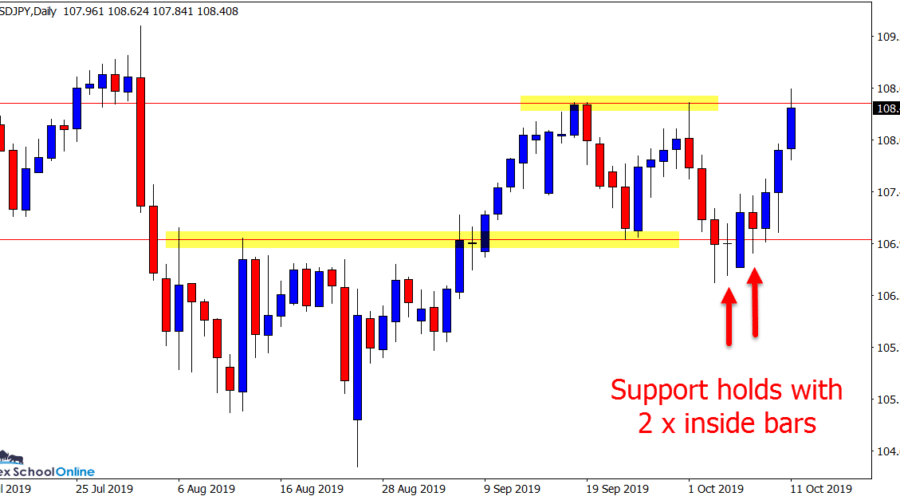
Weekly Price Action Trade Ideas – 7th to 11th Oct 2019 Markets Discussed in This Week’s Trade Ideas: USDJPY, GBPUSD, AUDUSD and SILVER. Note: We Use Correct ‘New York Close 5 Day Charts’ – You can read about why we use these and how to download the correct free charts at Correct Free …


