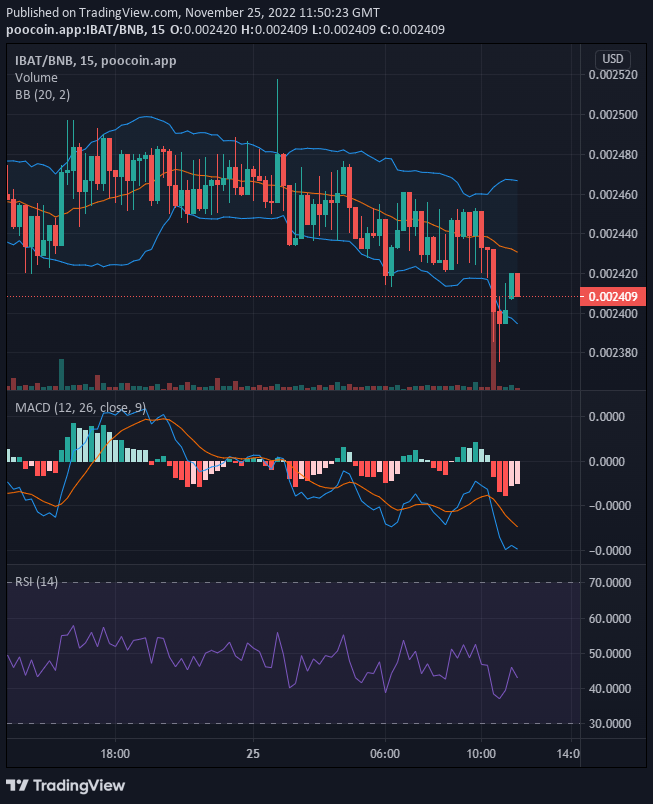
Battle Infinity’s price has been ranging sideways for like a day and a half. But, towards the end of the last session, the bullish move was rejected at the resistance level and the price of the market fell below the 20-day moving average. Since today’s trading session started, the bullish price repeatedly fails in its attempt to cross above the moving average, therefore the market leans slightly in favour of the bears. Then in the 10th hour of the day’s trading session, a spike in the volume of trade resulted in a drastic fall in the price. But new bullish support at $0.0024 stops the bearish move.
Key Levels
- Resistance: $0.0027, $0.0028, $0.0029
- Support: $0.0022 $0.0021, $0.0020
IBAT/USD: The Indicators’ Outlook
The Spinning top doji candlestick at the $0.0024 price level signifies a massive struggle with no clear direction of the price. This for now may be the result of a low volume of trade. As the volume of trade increases, it is very likely we see a bullish recovery taking up with full momentum. In the MACD indicator, the histograms are on the negative side and the two lines have crossed below level zero. This is a clear indication of a bearish price.

Battle Infinity Short-Term Outlook: Bullish Recovery (15-minute chart)
However, from this point of view, we can see the bullish recovery in progress as the bullish price has attained a new price level. The MACD now has faded red histograms which is a sign of bullish activities. The RSI line is still measuring 43 in the sell zone of the indicator. This is a very good opportunity to buy IBAT because buying at a low price will allow investors to maximize profit when the price rises.
Want a coin that has a huge potential for massive returns? That coin is Battle Infinity.
Buy IBAT now.


Leave a Reply