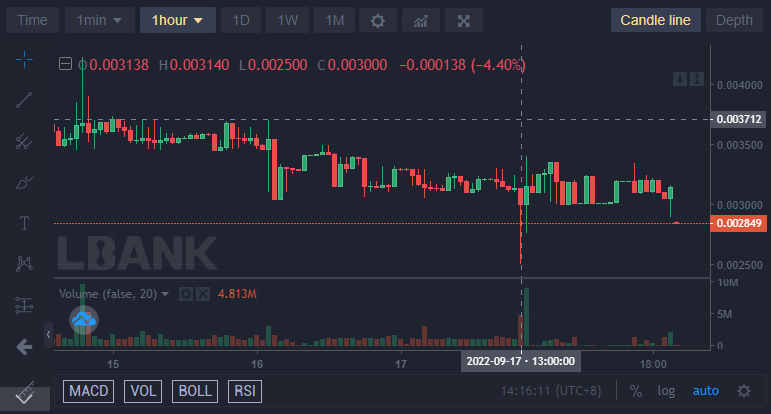
The Battle Infinity market has gone in favour of the sellers for so long that it is now in the oversold zone. What we should expect now is that the price will retrace an upper level and even resume the uptrend. Already the selling pressure in the market is reducing and it will eventually result in an uptrend.
Key Levels
Resistance: $0.003454, $0.003500, $0.003556
Support: $0.003300, $0.003200, $0.003100
IBAT/USD: The Indicators’ Outlook
The indicators are not yet showing positive signs of price recovery, but when we look into the market from a smaller timeframe, we can see that the price is recovering. Very soon, the price recovery will begin to reflect on the bigger timeframe. However the Bollinger Band indicator shows the latest candlestick breaking through the lower band of the indicator, this signifies a bullish price recovery.

Battle Infinity Short-Term Outlook: Bullish Recovery (15-minute chart)
The Outlook of the Moving Average Convergence and Divergence indicator show a market that is recovering from the far depth of the lower market. The negative histograms are now appearing in pink colours and the heights are decreasing very fast. The MACD lines are slowing down for a retracement to the upper level. The Relative Strength Index line which is now already in the oversold zone of the indicator is now slowly recovering. It is already at 20%.
Want a coin that has a huge potential for massive returns? That coin is Battle Infinity.
Buy IBAT now.


Leave a Reply