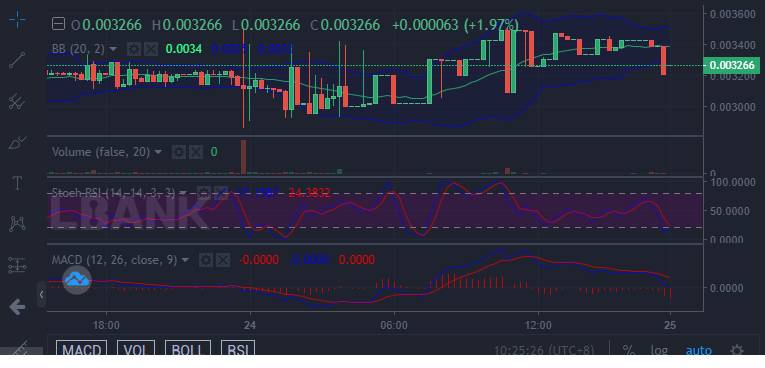
From the Battle Infinity market outlook of yesterday, we saw how bulls steadily progress to an upward price level. Although the advancement was slow, the upward movement is now gaining momentum. Like what we saw yesterday, the volatility is still high, but the bulls are having the upper hand. Also, From the recent candlestick patterns, we see that the two forces are now matching up.
Key Levels
Resistance: $0.003600, $0.003650, $0.003700
Support: $0.003000, $0.002500, $0.002000
IBAT/USD: The Indicators’ Outlook
The Relative Strength Index is showing a market strength of 66% and the MACD lines are moving above the positive histograms. These two indicators are pointing to a bullish market. However for now we see the momentum reducing as traders are closing their positions to take profits. The RSI line and the MACD line are showing signs of downward retracement. The uptrend will continue, the price retracement does not mean that the trend has changed.
The Bollinger band indicator shows that due to this intense struggle, the market is entering into a consolidation period. The upper band and the lower band are compressing against the market activities. After the ranging market, there is going to be a decisive directional move. Battle Infinity is going to rise to an upper price level after the consolidation period.

Battle Infinity Short-Term Outlook: Bullish Recovery (15-minute chart)
By the nature of this short-term outlook, price actions are rather more erratic here. In the MACD indicator, the histograms have moved to the negative side, but the two MACD lines are still on the positive side trying to enter the negative side. But we can at least with the help of the Bollinger band predict the next direction of the market. As the latest candle breakthrough the lower band of the Bollinger, we know that the price will soon correct to an upward price level.
Want a coin that has a huge potential for massive returns? That coin is Battle Infinity.
Buy IBAT now.


Leave a Reply