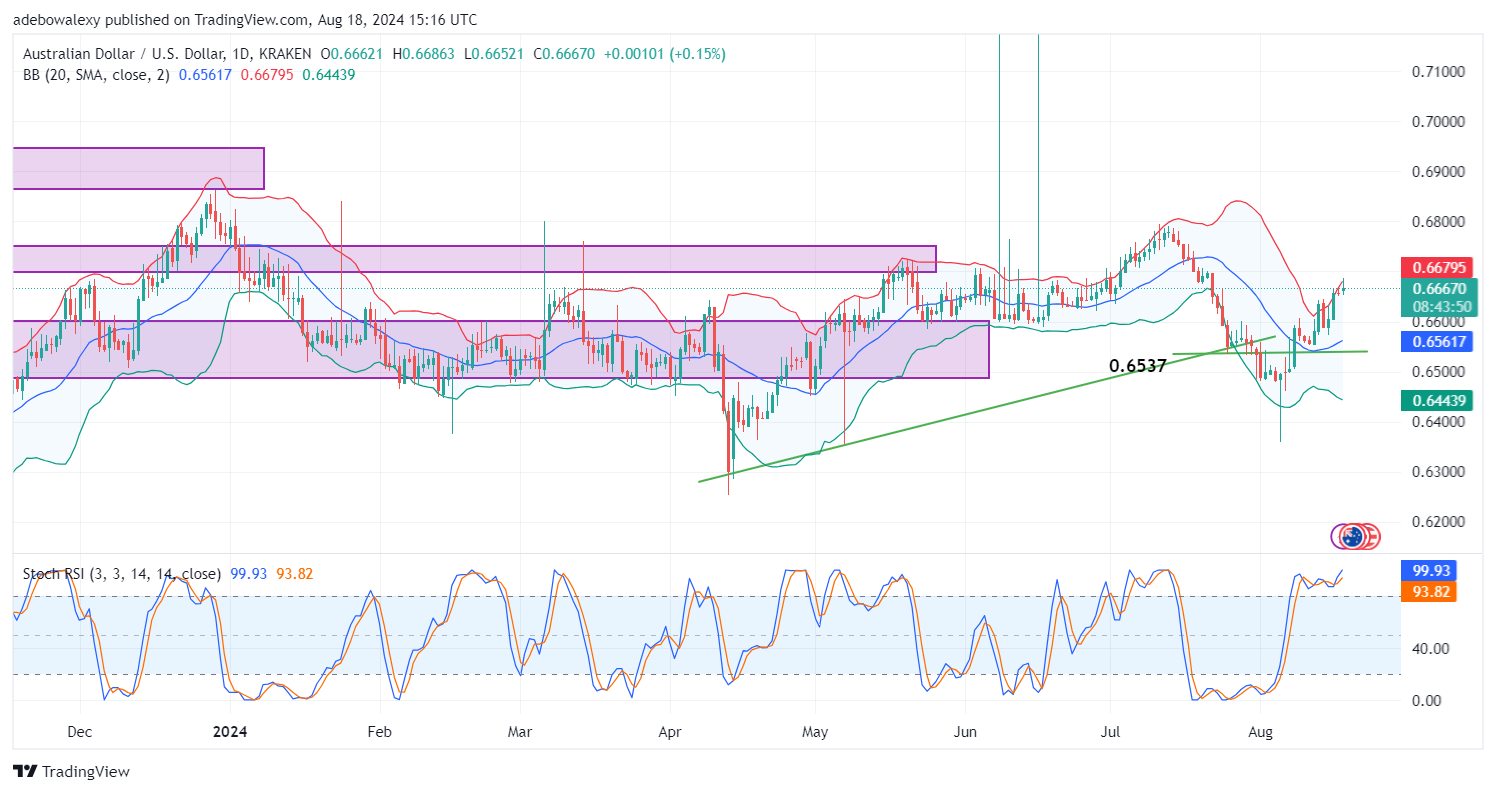
Despite the improved mood of the US dollar, stimulated by economic data from the previous week, the AUDUSD pair has continued its upward trajectory. The closing session of the last week ended in the green, keeping price action above key technical levels.
Key Price Levels:
Resistance Levels: 0.6700, 0.6800, 0.6900
Support Levels: 0.6600, 0.6500, 0.6400
AUDUSD Price Action Looks Strained
As noted earlier, price action in the AUDUSD market has continued to rise. The market moved sharply upward during the past two sessions, bringing it close to the upper limit of the Bollinger Bands (BB) indicator. In response, the BB indicator has widened to accommodate bullish progress in the market.
The last price candle shows that upside forces are still actively propelling the market. The Stochastic Relative Strength Index (SRSI) lines are still rising in the overbought region, affirming the strength of buyers in the market.
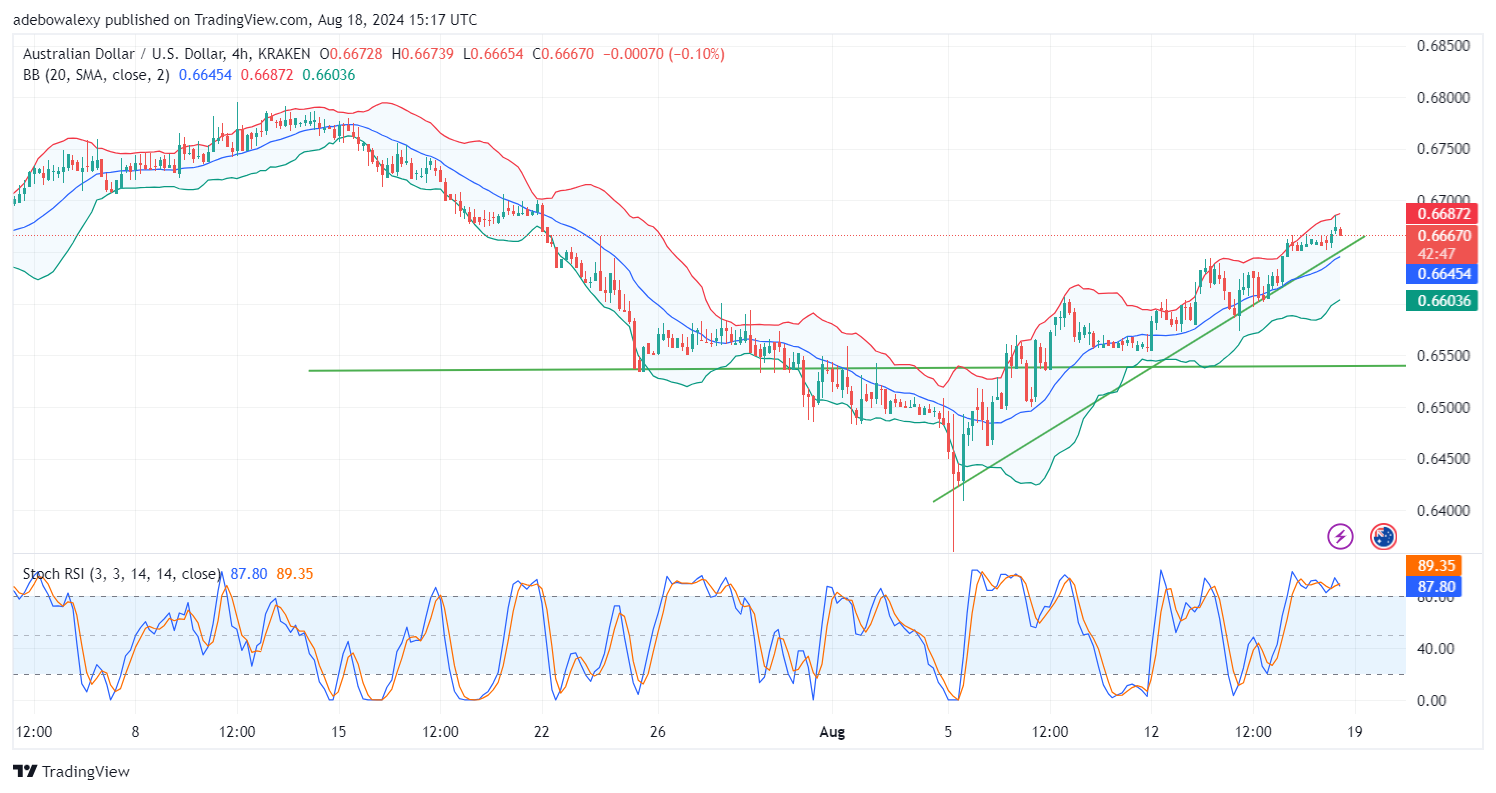
AUDUSD Extends Downward Rejection on a 4-hour Price Chart
From a broader perspective, price movement in the AUDUSD market still has an upward trajectory. Price action remains above the drawn upside-sloping trendline and the middle limit of the BB indicator. Even the BB indicator itself has an upward bias, which reflects the prevalent trend in the market.
However, it should be noted that the SRSI indicator lines have delivered a downward crossover in the oversold region. This signals that the new week may offer more bearish impetus, with the Fed speech and auction bill set to be released tomorrow. Therefore, traders can anticipate a dip toward the 0.6650 mark, pending a possible continuation of the upward correction.
Do you want to take your trading to the next level? Join the best platform for that here.


Leave a Reply