AUD/USD Price Prediction – October 16
In the bid of a bearish-trending force continuation, the AUD/USD market rate of exchange falls under the 0.6400 trading line. The currency pair price bags a negative percent of 1.58 to trade around the 0.61990 value line as of the time of writing.
AUD/USD Market
Key Levels:
Resistance levels: 0.6400, 0.6500, 0.6600
Support levels: 0.6100, 0.6000, 0.5900
AUD/USD – Daily Chart
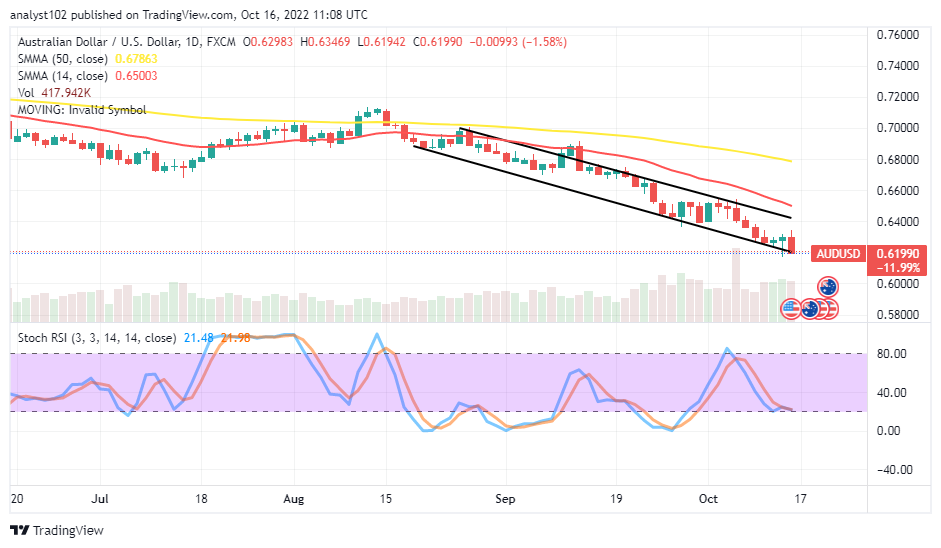
The daily chart reveals the AUD/USD market rate of exchange falls under the 0.6400 resistance level. The 14-day SMA trend line is at 0.65003, beneath the 0.67863 value line of the 50-day SMA trend line. The bearish channels have remained intently drawn to show the range pace the currency pair keeps to the south side. The Stochastic Oscillators are near above the range of 20, trying to clog their lines southbound briefly at 21.98 and 21.48 range points. That suggests the former trading instrument is prevailing muscles against its latter-trading tool. Will the AUD/USD market’s current downward trend continue to breach the 0.6100 support level?
It indicated on the daily trading chart that the AUD/USD market rate of exchange falls under the 0.6400 resistance level around a critical spot of the lower bearish trend line. With time, the currency pair may drop further past the 0.6100 support if bulls are not intensifying on rebuilding solid support around the current trading point.
On the technical downside, the AUD/USD market sellers will have a good trading outlook, as depicted from the reading f a 1-hour chart. And correlating conditions with a 4-hour chart occasionally needed to observe the early possibility posture of price resuming a decreasing move after rallying to a notable high zone before reconsidering the launching of a sell order afterward.
The technical analysis at a glance suggests the possibility of seeing the SUD/USD market operations still running in the way of bears, especially while reaching an overbought condition region on the 1-hour chart. AUD/USD 4-hour Chart
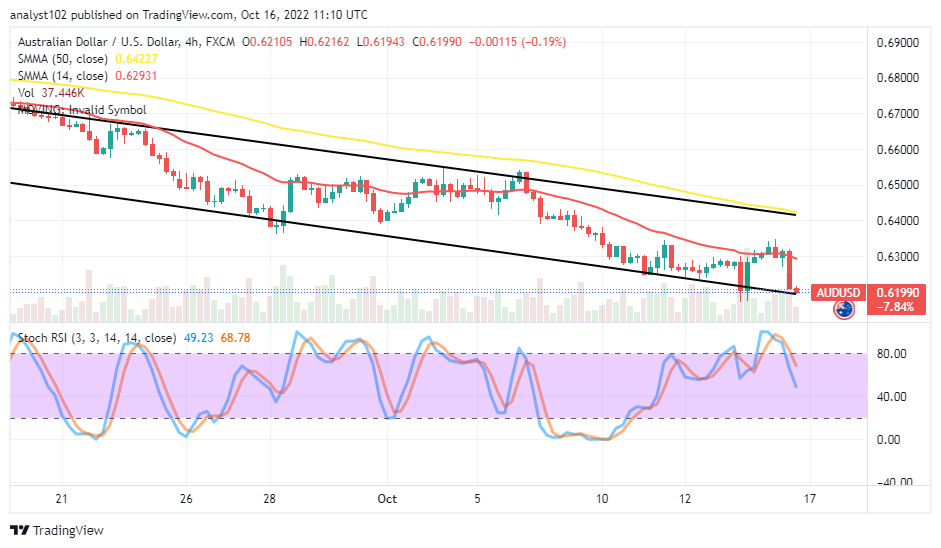
The medium-term AUD/USD chart reveals the current price rate of exchange falls around the 0.6300 resistance level after a line of about three 4-hour candlesticks showed rejections briefly over the value line before losing some pips not lesser than 100. The 14-day SMA indicator is at 0.62931, beneath 0.64227 of the 50-day SMA indicator. The Stochastic Oscillators have crossed southbound from the overbought region to reach 68.78 and 49.23 range values.
Note: Forexschoolonline.com is not a financial advisor. Do your research before investing your funds in any financial asset or presented product or event. We are not responsible for your investing results.
Learn to Trade Forex Online
AUD/USD Rate of Exchange Falls Under 0.6400
Footer

ForexSchoolOnline.com helps individual traders learn how to trade the Forex market
WARNING: The content on this site should not be considered investment advice and we are not authorised to provide investment advice. Nothing on this website is an endorsement or recommendation of a particular trading strategy or investment decision. The information on this website is general in nature so you must consider the information in light of your objectives, financial situation and needs.
Investing is speculative. When investing your capital is at risk. This site is not intended for use in jurisdictions in which the trading or investments described are prohibited and should only be used by such persons and in such ways as are legally permitted. Your investment may not qualify for investor protection in your country or state of residence, so please conduct your own due diligence or obtain advice where necessary. This website is free for you to use but we may receive a commission from the companies we feature on this site.
We Introduce people to the world of currency trading. and provide educational content to help them learn how to become profitable traders. we're also a community of traders that support each other on our daily trading journey
Forexschoolonline.com is not a financial advisor. Do your research before investing your funds in any financial asset or presented product or event. We are not responsible for your investing results.

Leave a Reply