AUD/USD Price Prediction – June 19
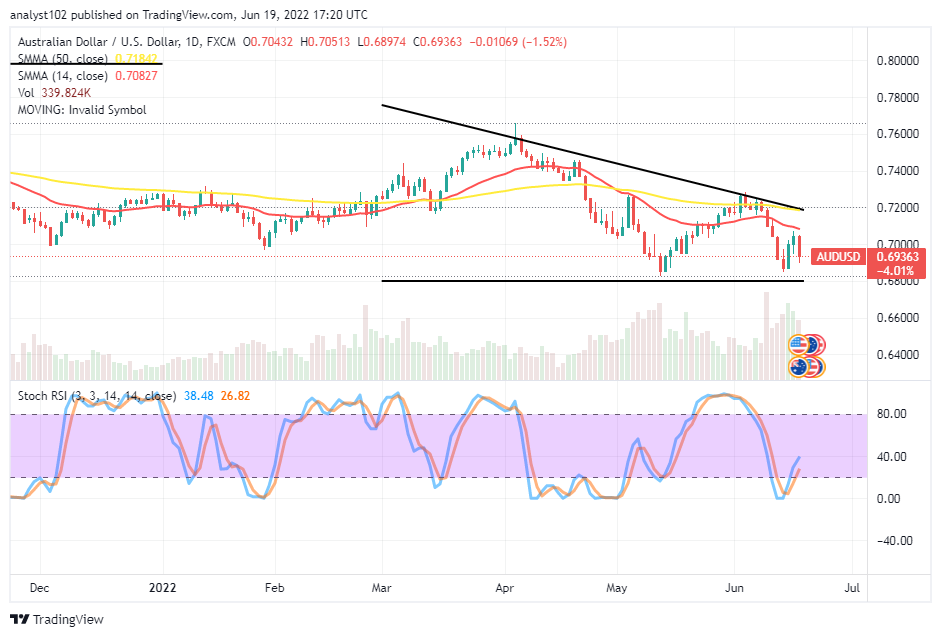
The AUD/USD market price keeps a downward reversion slightly below the 0.7000 level. The currency pair’s trading zones are at 0.7051 and 0.6897 value lines for the high and low figures as it maintains a 1.52% negative.
AUD/USD Market
Key Levels:
Resistance levels: 0.7000, 0.7100, 0.7200
Support levels: 0.6800, 0.6700, 0.6600
AUD/USD – Daily Chart
The AUD/USD daily chart reveals the currency pair price keeps a downward reversion at 0.7000. The baseline has been at the 0.6800 support level. The bearish trend line drew above the trading indicators southward, marking the logical points price has been rejecting before running back downward. The 14-day SMA is underneath the 50-day SMA indicator. It showcased that the smaller SMA is at 0.7082, and the bigger SMA is at 0.7184. The Stochastic Oscillators have crossed northbound from the oversold region toward the range of 40. A bearish candlestick is in the making, confirming a falling force is ongoing. Will the AUD/USD market extend downward reversion beyond the 0.6800 support level??
There can be an extension in the AUD/USD price reversion downward intensely if a gap has to occur to the downside. In the process of that assumption, buyers would have to suspend their re-launching of new positions ordering for a while.
On the downside of the technical analysis, sellers of the AUD/USD trade are to have opened a selling order around the 0.7000 resistance level and managed the position by placing a stop-loss order between the 0.7100 and 0.7200 resistance levels.
The analytics, at a glance, traders are to be on the lookout for the reaction of price toward the downside direction before considering joining. Sellers should be wary of the late execution of orders. And they needed to back up their entries with active price action tends to favor the southward motion. AUD/USD 4-hour Chart
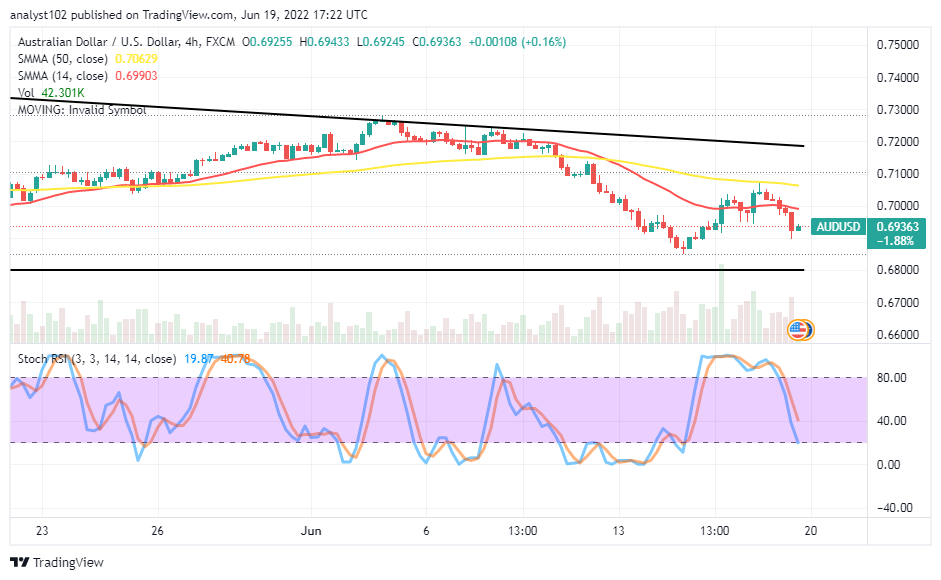
The AUD/USD medium-term chart shows price keeps a downward reversion beyond the 0.7000 level underneath the SMA trend lines. The 14-day SMA trading indicator is underneath the 50-day SMA indicator. The actual resistant-trading spots under this chart setting suggest 0.6990 and 0.7062 against the subsequent upward sessions if the market will have to rebound in the near medium-term running outward bound. The Stochastic Oscillators have crossed southbound from the oversold region close to the range of 20. Traders should be cautious about launching new orders at this point.
Note:Forexschoolonline.com is not a financial advisor. Do your research before investing your funds in any financial asset or presented product or event. We are not responsible for your investing results.
Learn to Trade Forex Online
AUD/USD Price Keeps a Downward Reversion at 0.7000
Footer

ForexSchoolOnline.com helps individual traders learn how to trade the Forex market
WARNING: The content on this site should not be considered investment advice and we are not authorised to provide investment advice. Nothing on this website is an endorsement or recommendation of a particular trading strategy or investment decision. The information on this website is general in nature so you must consider the information in light of your objectives, financial situation and needs.
Investing is speculative. When investing your capital is at risk. This site is not intended for use in jurisdictions in which the trading or investments described are prohibited and should only be used by such persons and in such ways as are legally permitted. Your investment may not qualify for investor protection in your country or state of residence, so please conduct your own due diligence or obtain advice where necessary. This website is free for you to use but we may receive a commission from the companies we feature on this site.
We Introduce people to the world of currency trading. and provide educational content to help them learn how to become profitable traders. we're also a community of traders that support each other on our daily trading journey
Forexschoolonline.com is not a financial advisor. Do your research before investing your funds in any financial asset or presented product or event. We are not responsible for your investing results.

Leave a Reply