AUD/USD Price Prediction – April 25
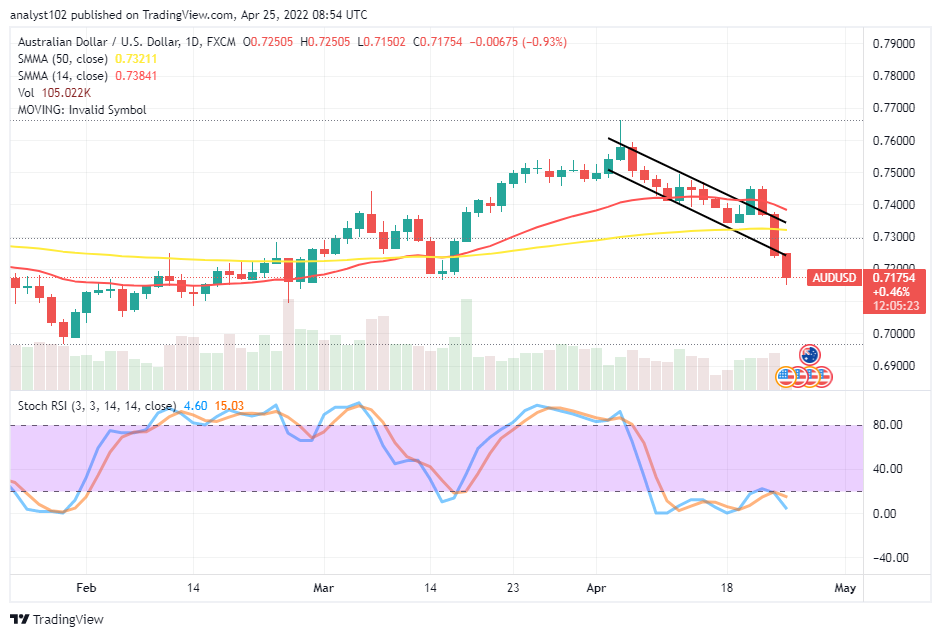
The AUD/USD price drops to extend in a downward move to affirm that the currency pair now trades in a bearish outlook. The financial book records that the market witnessed a high of 0.72505 as the opening balance. But, presently is around 0.71502 at a minute negative percentage of 0.93.
AUD/USD Market
Key Levels:
Resistance levels: 0.7300, 0.7400, 0.7500
Support levels: 0.7100, 0.7000, 0.6900
AUD/USD – Daily Chart
The AUD/USD daily chart showcases the currency pair price drops, extending in a downward move beneath the trading indicators. The bearish channel trend lines are drawn southward slightly past the SMAs. The 14-day SMA indicator is above the 50-day SMA indicator. A bearish candlestick is currently spanning a dip down to indicate that a falling force is ongoing. The Stochastic Oscillators are in the oversold region, trying to cross their lines southbound. Can there be more intense dip-downs in the AUD/USD market as price drops, extending in a downward move?
There can be more dip-downs in the AUD/USD market operations if the market fails to resume a rebounding motion against the 0.7200 trading level as the currency pair price drops, extending in a downward move. Long-position takers may now have to stay alert until a bullish candlestick forms at a lower trading spot before considering a buying order.
On the downside of the technical analysis, the AUD/USD market short-position takers may have to consolidate in their pushing efforts around the 0.7200 to exhaust the current downward force. However, if some active reversal moves are spotted, it could be a warning signal against getting more reliable downs.
The analytics, at a glance, as the AUD/USD market runs down in a consolidation manner under an oversold condition, could in no time lead to a rebounding motion, especially while a full-body bullish candlestick emerges eventually from the depth of a lower trading zone afterward. AUD/USD 4-hour Chart
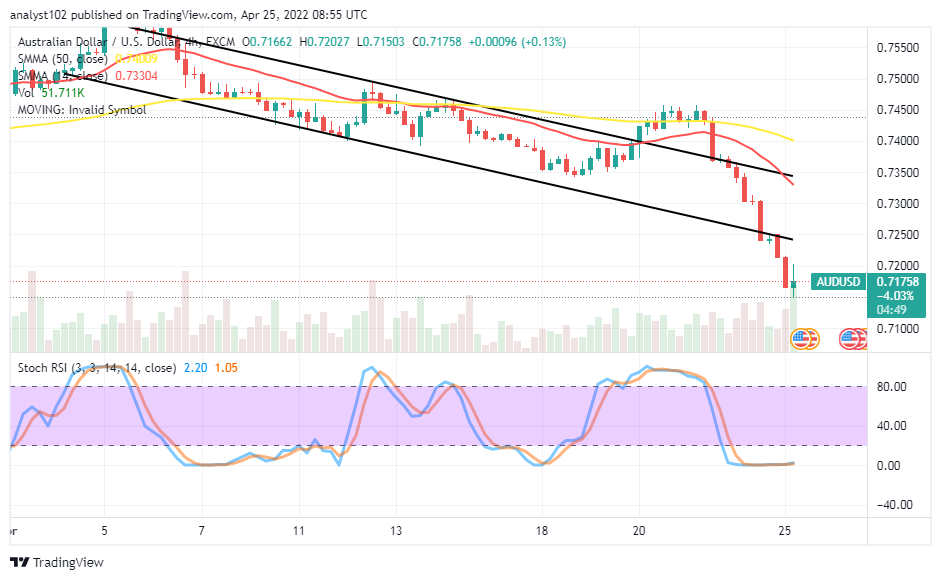
The AUD/USD medium-term chart showcases the currency pair price drops, extending in a downward move past the trading indicators. The 14-day SMA indicator is underneath the 50-day SMA indicator. And they bend to the south direction far above the current trading zone. The Stochastic Oscillators are in the oversold region, tightly moving in a consolidation manner around the zero range. That could mean the market may soon experience either a pit stop at a lower spot or witness a rebound after a while when the trade lacks the capacity to break past variant support levels of 0.7100 and 0.7000.
Note:Forexschoolonline.com is not a financial advisor. Do your research before investing your funds in any financial asset or presented product or event. We are not responsible for your investing results.
Learn to Trade Forex Online
AUD/USD Price Drops, Extending in a Downward Move
Footer

ForexSchoolOnline.com helps individual traders learn how to trade the Forex market
WARNING: The content on this site should not be considered investment advice and we are not authorised to provide investment advice. Nothing on this website is an endorsement or recommendation of a particular trading strategy or investment decision. The information on this website is general in nature so you must consider the information in light of your objectives, financial situation and needs.
Investing is speculative. When investing your capital is at risk. This site is not intended for use in jurisdictions in which the trading or investments described are prohibited and should only be used by such persons and in such ways as are legally permitted. Your investment may not qualify for investor protection in your country or state of residence, so please conduct your own due diligence or obtain advice where necessary. This website is free for you to use but we may receive a commission from the companies we feature on this site.
We Introduce people to the world of currency trading. and provide educational content to help them learn how to become profitable traders. we're also a community of traders that support each other on our daily trading journey
Forexschoolonline.com is not a financial advisor. Do your research before investing your funds in any financial asset or presented product or event. We are not responsible for your investing results.

Leave a Reply