AUD/USD Price Prediction – AUGUST 14
It has been that the AUD/USD market price breaks through variant resistances have occurred around the 0.7000, former difficult for the trade to push past recently. When the upward motion featured intensely, a high value was achieved at 0.7128 and witnessed a low point at 0.7084. The price is trading at 0.7121 at a minimal positive percentage rate of 0.27.
AUD/USD Market
Key Levels:
Resistance levels: 0.7150, 0.7200, 0.7250
Support levels: 0.7050, 0.7000, 0.6950
AUD/USD – Daily Chart
The AUD/USD daily chart depicts the currency pair price breaks through variant resistances to feature over the trend lines of the SMAs. The 50-day SMA indicator is at 0.70378 above the 0.69646 value line of the 14-day SMA indicator. The Stochastic Oscillators have crossed the lines northbound from within the 20 and 40 range lines, touching the range of 79.24 and partially into the overbought region. The trading outlook, as of writing, still suggests an upward pressure is ongoing.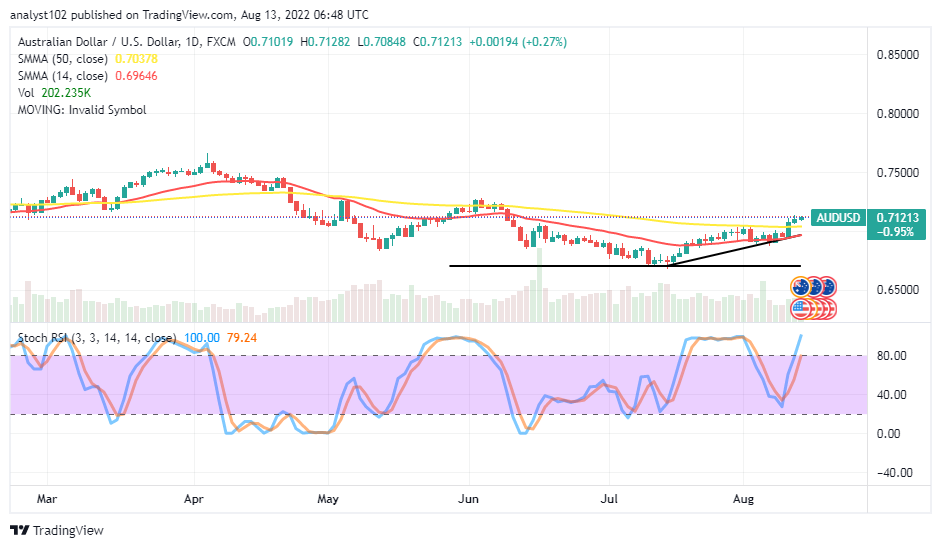 Will the AUD/USD market run for higher pip points over the SMA trend lines?
The AUD/USD market may still run for higher pip points over the SMA trend lines if no bearish candlestick emerges in the current trading spot as the currency pair price breaks through variant resistances recently encountered. The pivotal underlying support level to the current-upward trading moment observes around the trend line of the 50-day SMA at 0.70378. Therefore, a successful price reversal movement against the value line will signal the possibility of seeing bulls losing while trying to make an up stride over the buying signal side of the tool shortly afterward.
On the downside of the technical, the AUD/USD market bears will have to exercise caution until a bearish candlestick tends to resurface around a resistant-trading spot over the SMAs before getting repositioning to consider a selling order. Traders should back their selling order with active price action in the direction of a downward trend force.
The analytics, at a glance, traders need to exercise some degrees of cautiousness at the moment before placing another order of any direction in the AUD/USD market.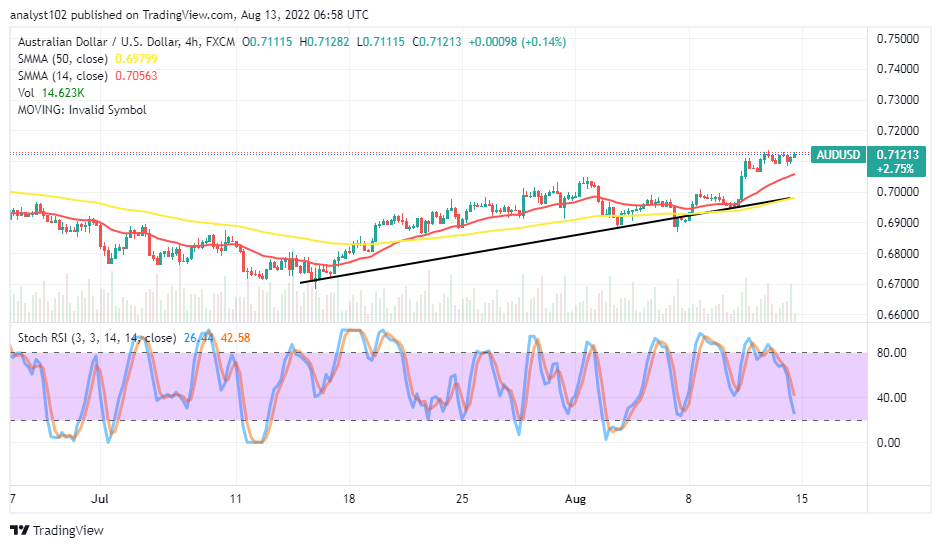 AUD/USD 4-hour Chart
The AUD/USD medium-term chart showcases the fiat pair trades in a bullish outlook over the trend lines of the trading indicators. The bullish trend line touches the psychological bottom line of the different bullish candlesticks, representing the key areas where price has been swinging upward. The Stochastic Oscillators have crossed southbound from the overbought region to get positioned around the 42.58 and 26.44 range points. That indicates a slight pause is playing out in the market. The smaller SMA signifies a critical support point is at 0.70563, and if price reverses fearfully will portend a risk downfall.
Note:Forexschoolonline.com is not a financial advisor. Do your research before investing your funds in any financial asset or presented product or event. We are not responsible for your investing results.
Learn to Trade Forex Online
AUD/USD Price Breaks Through Variant Resistances
Footer

ForexSchoolOnline.com helps individual traders learn how to trade the Forex market
WARNING: The content on this site should not be considered investment advice and we are not authorised to provide investment advice. Nothing on this website is an endorsement or recommendation of a particular trading strategy or investment decision. The information on this website is general in nature so you must consider the information in light of your objectives, financial situation and needs.
Investing is speculative. When investing your capital is at risk. This site is not intended for use in jurisdictions in which the trading or investments described are prohibited and should only be used by such persons and in such ways as are legally permitted. Your investment may not qualify for investor protection in your country or state of residence, so please conduct your own due diligence or obtain advice where necessary. This website is free for you to use but we may receive a commission from the companies we feature on this site.
We Introduce people to the world of currency trading. and provide educational content to help them learn how to become profitable traders. we're also a community of traders that support each other on our daily trading journey
Forexschoolonline.com is not a financial advisor. Do your research before investing your funds in any financial asset or presented product or event. We are not responsible for your investing results.
Leave a Reply