AUD/USD Prediction – August 30
The AUD/USD financial book of records now has it that the fiat currency pair’s price beefs up from a lower trading zone to trade around the level of 0.7311. The market’s percentage rate of trading is at 1.04 as of writing.
AUD/USD Market
Key Levels:
Resistance levels: 0.7400, 0.7500, 0.7600
Support levels: 0.7200, 0.7100, 0.7000
AUD/USD – Daily Chart
The AUD/USD daily chart has revealed that the currency pair’s price beefs up from around 0.7100 to trade around the line at 0.7311. The emergence of a bullish candlestick at a higher value signifies that the market is at a crucial determining point of changing the market direction into a northward side or a return of the bearish trend continuation. The 14-day SMA indicator trends alongside the upper bearish channel trend-line drew underneath the 50-day SMA indicator. The Stochastic Oscillators have freshly moved into the overbought region, seemingly attempting to close the lines close a bit over the range of 80. That signals the possibility that price could witness less-active motion around a resistance trading zone of the upper bearish channel trend-line.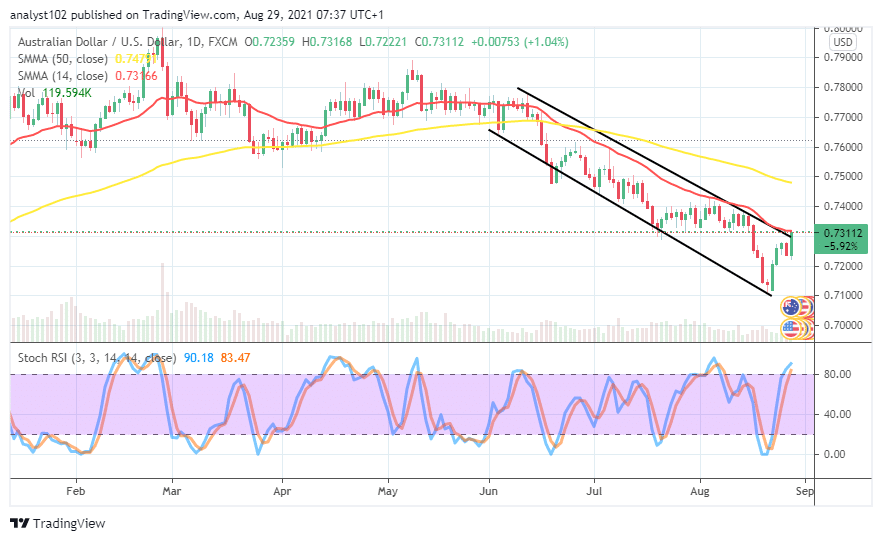 Could there soon be a change of trend direction as the AUD/USD price beefs up to trade around the upper bearish channel trend-line?
The long-featuring of the currency pair market around the upper bearish channel trend-line may not be too palatable to suggest the possibility of seeing a change of direction to favor the further upside. Currently, as the AUD/USD price beefs up, trading around the conjoined spot of the upper bearish channel trend-line and the 14-day SMA indicator showcases that bulls are striving for recovery. At this point, an aggressive breakout of 0.7300 needed to change the movement into a more visible northwardly.
On the downside, 0.7300 is the main resistance line that the present bearish trend needed to stay firm against any further northward pushes if the bearish channels would remain relevant in the subsequent sessions. In a sense, the price has sprung up to a desirable higher resistance trading path the AUD/USD bears needed to regain the momentum.
In summary, 0.73000 is now the trading line that will play a crucial role in determining whether the bearish channel trend lines will remain valid in the subsequent operations. A forceful breakout at the point may potentially portend a solid grand for northward movements that may feature in the transaction days ahead.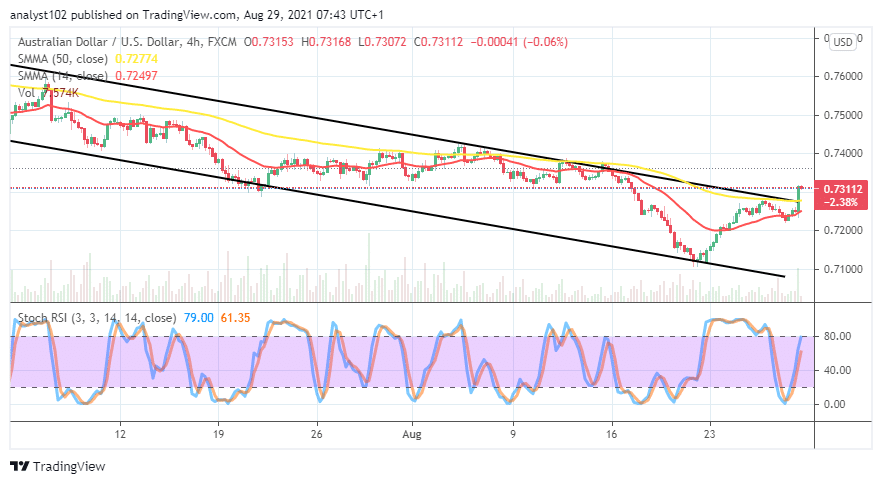 AUD/USD 4-hour Chart
The 4-hour AUD/USD chart depicts that the currency pair’s price beefs up to briefly trade past the bigger SMA trend-line and the upper bearish channel trend-line. A warning signal has emanated from a bullish candlestick around the level of 0.7300. The 14-day SMA indicator bends northward close beneath the 50-day SMA indicator. The Stochastic Oscillators have moved the lines northbound with the blue line, touching the range 80. That signifies that some degrees of buying pressures are ongoing in the currency pair market.
Note: Forexschoolonline.com is not a financial advisor. Do your research before investing your funds in any financial asset or presented product or event. We are not responsible for your investing results.
Learn to Trade Forex Online
AUD/USD Price Beefs up, Trading at 0.7300 Level
Footer

ForexSchoolOnline.com helps individual traders learn how to trade the Forex market
WARNING: The content on this site should not be considered investment advice and we are not authorised to provide investment advice. Nothing on this website is an endorsement or recommendation of a particular trading strategy or investment decision. The information on this website is general in nature so you must consider the information in light of your objectives, financial situation and needs.
Investing is speculative. When investing your capital is at risk. This site is not intended for use in jurisdictions in which the trading or investments described are prohibited and should only be used by such persons and in such ways as are legally permitted. Your investment may not qualify for investor protection in your country or state of residence, so please conduct your own due diligence or obtain advice where necessary. This website is free for you to use but we may receive a commission from the companies we feature on this site.
We Introduce people to the world of currency trading. and provide educational content to help them learn how to become profitable traders. we're also a community of traders that support each other on our daily trading journey
Forexschoolonline.com is not a financial advisor. Do your research before investing your funds in any financial asset or presented product or event. We are not responsible for your investing results.
Leave a Reply