AUD/USD Prediction – November 29
It observed that the AUD/USD price lately averages the low line at 0.7100. The currency pair market trades around 0.7146, bagging a smaller positive percentage rate of 0.46.
AUD/USD Market
Key Levels:
Resistance levels: 0.7200, 0.7300, 0.7400
Support levels: 0.7100, 0.7000, 0.6900
AUD/USD – Daily Chart
The AUD/USD daily chart reveals that the currency pair market’s price averages the low at 0.7100 to now possibly complete the recent downing motions as it did around the August 20th session. The 14-day SMA indicator is far above the current trading zone beneath the 50-day SMA indicator. That indicates that the rate of depressions in the market keeps heightening against any possible attempt to re-surge. The bearish channel trend lines intently drew to observe the path that the market maintains to the downside. The Stochastic oscillators are in the oversold region, trying to open the lines northbound after a notable movement in a consolidation manner. That suggests that the market may soon start to experience some motions to the north side.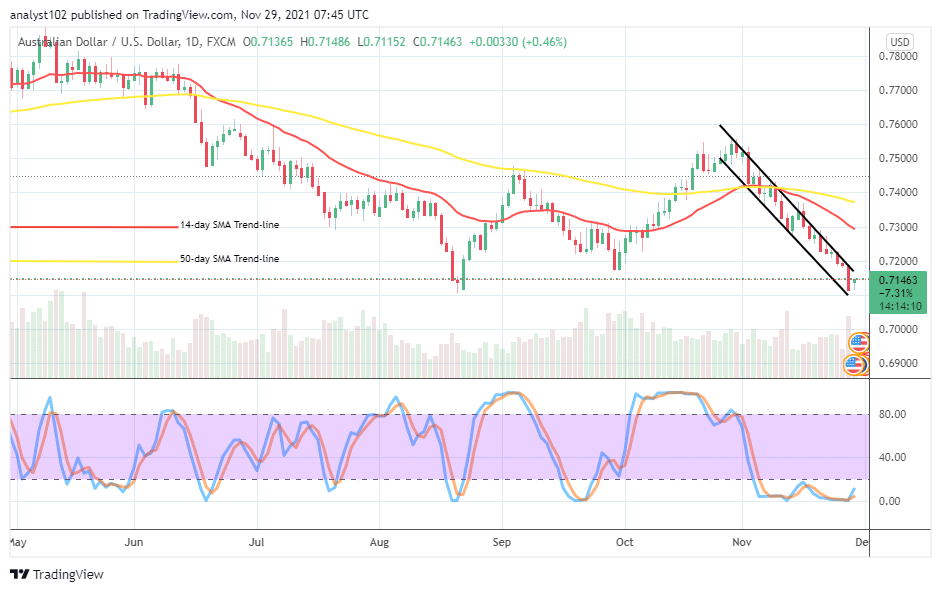 Should traders opine that the AUD/USD market has reached a genuine support level as the price averages the low at 0.7100?
Technically, it presently shows that the AUD/USD market has once reached pushed downside to rebuild support as the currency pair price averages the low at 0.7100. The market is still moving in a consolidation moving mode that capable of leading still into some more lows on a gradual note. That value-line mentioned earlier stands to be the pivotal trading zone against a further downsizing motion if the price tends lowering more. At this point, buyers needed to brace up, looking a decent long entry before exerting an order.
On the downside of the AUD/USD market technical analysis, sellers seem to have headed to one of the critical trading zones currently, showing an unsafe trading environment to launch more shorting orders. Instead, it would be a psychological ideal that they stay out of the market for a while to avoid an unnecessary bear trap in no time despite that there has been no tangible bullish signal as of writing.
Summarily, as there has been no strong bullish signal presently, buyers needed o to be on the lookout to start taking positions with smaller leverage on a long-term basis. Short-term buyers may still wait a bit longer to confirm while a bullish candlestick emerges to engulf some of the past lower candlesticks before taking positions.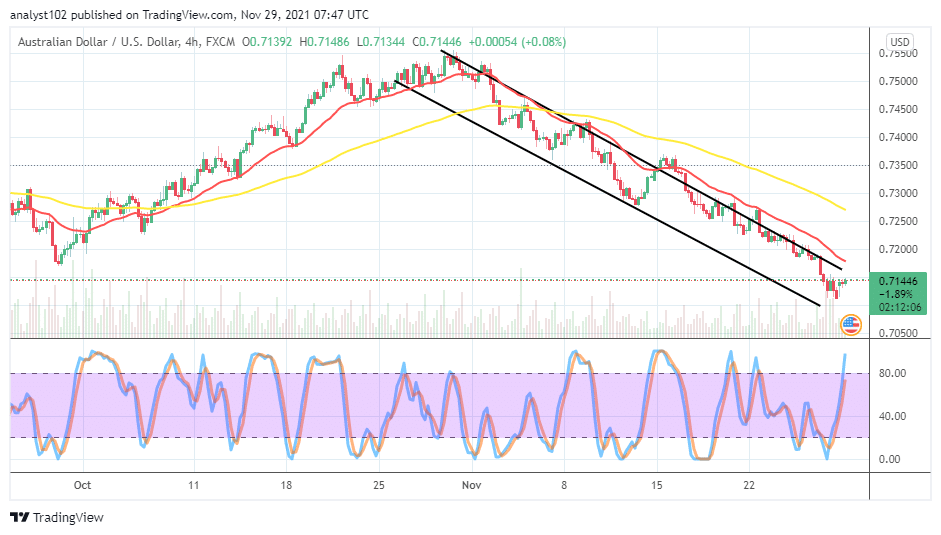 AUD/USD 4-hour Chart
The AUD/USD medium-term chart showcases that the currency pair price averages the low low at 0.7100 under the sell signal side of the smaller SMA indicator. The 50-day SMA trend line is above the 14-day SMA trend line. The bearish channel trend lines complement the bearish outlook reading given by the SMA indicator. The Stochastic Oscillators have briefly swerved into the overbought region to indicate that an upward motion is imminent, possibly in the near time.
Note: Forexschoolonline.com is not a financial advisor. Do your research before investing your funds in any financial asset or presented product or event. We are not responsible for your investing results.
Learn to Trade Forex Online
AUD/USD Price Averages the Low at 0.7100
Footer

ForexSchoolOnline.com helps individual traders learn how to trade the Forex market
WARNING: The content on this site should not be considered investment advice and we are not authorised to provide investment advice. Nothing on this website is an endorsement or recommendation of a particular trading strategy or investment decision. The information on this website is general in nature so you must consider the information in light of your objectives, financial situation and needs.
Investing is speculative. When investing your capital is at risk. This site is not intended for use in jurisdictions in which the trading or investments described are prohibited and should only be used by such persons and in such ways as are legally permitted. Your investment may not qualify for investor protection in your country or state of residence, so please conduct your own due diligence or obtain advice where necessary. This website is free for you to use but we may receive a commission from the companies we feature on this site.
We Introduce people to the world of currency trading. and provide educational content to help them learn how to become profitable traders. we're also a community of traders that support each other on our daily trading journey
Forexschoolonline.com is not a financial advisor. Do your research before investing your funds in any financial asset or presented product or event. We are not responsible for your investing results.
Leave a Reply