AUD/USD Prediction – October 25
The AUD/USD market operation moves in bullish channels as the currency pair price trades around 0.7498. The fiat currency percentage rate of trading is at 0.43 positive. The base coin is striving at pushing the position against the counter-trading instrument as of writing.
AUD/USD Market
Key Levels:
Resistance levels: 0.7600, 0.7700, 0.7800
Support levels: 0.7300, 0.7200, 0.7100
AUD/USD – Daily Chart
The AUD/USD daily chart showcases that the market operation moves in bullish channel trend lines to show the paths of price recovery motion. Despite the upward pressures, the 14-day SMA indicator is closely beneath the 50-day SMA indicator, pointing toward the north around the level of 0.7400. The Stochastic Oscillators have briefly moved southbound across the range of 80. And, they now seemingly are trying to close the lines a bit below the range value line. That suggests the need that traders may have to exercise some degrees of trade pre-cautiousness.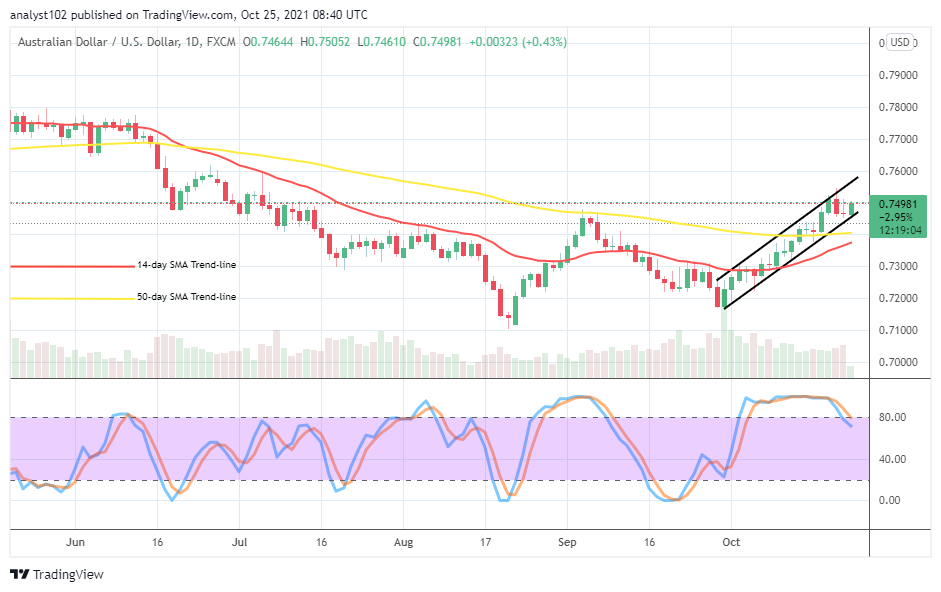 Should traders focus more on looking for buying entry than selling signs as the AUD/USD market operation moves in bullish channels?
It presently appears that the pressures to the upside are getting heightening as the AUD/USD market operation moves in bullish channel trend lines. As a result, it would be technically ideal that buyers continue to watch out for decent buying entries either in the channels or around the buy signal side of the bigger SMA indicator. However, a sudden breakdown at 0.7400 may lead to re-settling the market for variant retracement processes.
.
On the downside, the 0.7500 market line appears to be the crucial trading zone that the AUD/USD market sellers will have to intensify their efforts at rebuilding their presence. The emergence of a bearish candlestick on October 21 has put a mark that there is a probability that the market may not smoothly surge northward further beyond the next resistance level at 0.7600. If that assumption eventually runs out correctly, it means selling pressures will dominate the trading situation.
Summarily, as of writing, trading around the level of 0.7500 signifies that traders needed to be cautious of their entries, especially while no or less-active motions are in place. Retracement price motions may soon feature below the resistance level at 0.7600, while buyers tend to relax in their pushing efforts.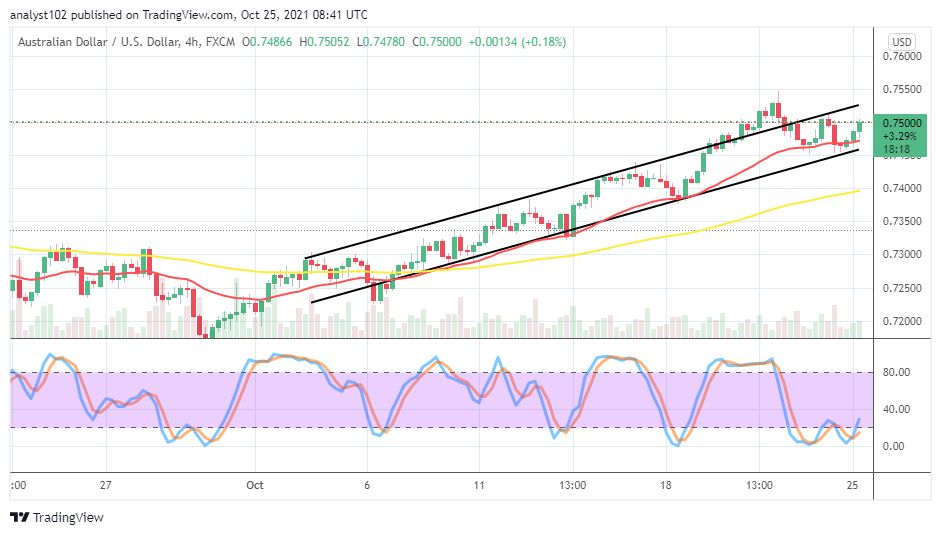 AUD/USD 4-hour Chart
The AUD/USD 4-hour chart depicted that the currency pair market operation moves around the bullish channel trend lines as there has been a clearer that a price retracement took place to find support at the lower bullish channel trend line. The 50-day SMA indicator is underneath the 14-day SMA indicator. The Stochastic Oscillators are consolidating around the range of 20, also dipping southbound in the oversold region. But, they are now crossing the lines briefly against the range value line, pointing to the north. It means that the Australian Dollar is striving to hedge against the US Dollar.
Note: Forexschoolonline.com is not a financial advisor. Do your research before investing your funds in any financial asset or presented product or event. We are not responsible for your investing results.
Learn to Trade Forex Online
AUD/USD Market Operation Moves in Bullish Channels
Footer

ForexSchoolOnline.com helps individual traders learn how to trade the Forex market
WARNING: The content on this site should not be considered investment advice and we are not authorised to provide investment advice. Nothing on this website is an endorsement or recommendation of a particular trading strategy or investment decision. The information on this website is general in nature so you must consider the information in light of your objectives, financial situation and needs.
Investing is speculative. When investing your capital is at risk. This site is not intended for use in jurisdictions in which the trading or investments described are prohibited and should only be used by such persons and in such ways as are legally permitted. Your investment may not qualify for investor protection in your country or state of residence, so please conduct your own due diligence or obtain advice where necessary. This website is free for you to use but we may receive a commission from the companies we feature on this site.
We Introduce people to the world of currency trading. and provide educational content to help them learn how to become profitable traders. we're also a community of traders that support each other on our daily trading journey
Forexschoolonline.com is not a financial advisor. Do your research before investing your funds in any financial asset or presented product or event. We are not responsible for your investing results.
Leave a Reply