AUD/USD Price Prediction – May 15
Currently, most of the instruments that are countered by the US Dollar have succumbed to falling forces. The AUD/USD market features a lower trading spot based on that fact. Price is trading at 0.6936 at 1.21 percent positives.
AUD/USD Market
Key Levels:
Resistance levels: 0.7100, 0.2300, 0.7300
Support levels: 0.6800, 0.6700, 0.6600
AUD/USD – Daily Chart
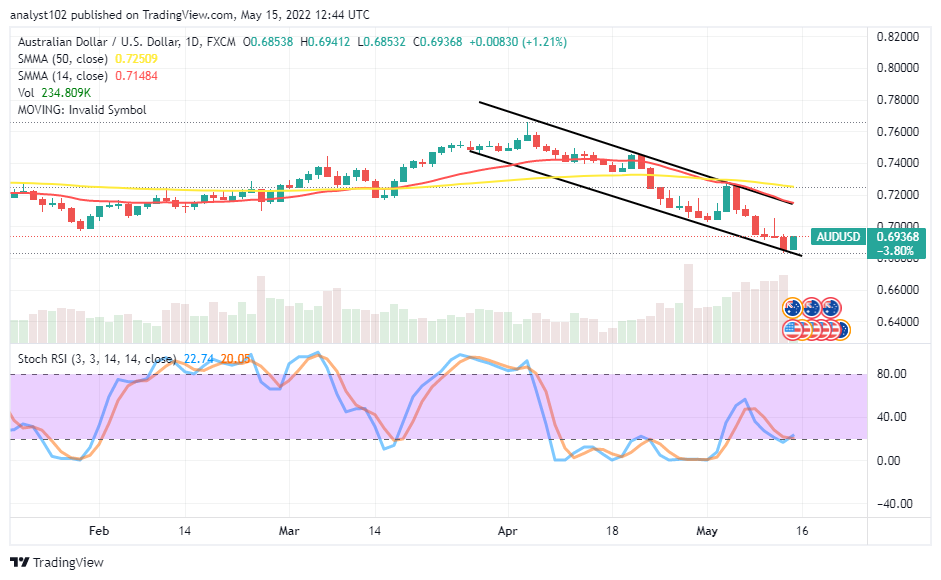
The AUD/USD daily chart showcases the currency pair market activity features at a lower trading spot. A set of two variant candlesticks has formed closely in an attempt to bottom over the 0.6800. The 14-day SMA indicator is underneath the 50-day SMA indicator. The Stochastic Oscillators have crossed southbound to touch the range of 20. And they are attempting to close at the range value line to signify a return of an upward force. Will the AUD/USD market remain firmed against a huge further free-fall?
Likely, the AUD/USD market may not surrender cheaply to a huge free-fall that can occur at this point of trading capacity. Subsequent attempts to make a downing move around the 0.6900 level may lead to getting bouncing-offs to allow long-position placers to make a buying order.
On the downside of the technical analysis, the AUD/USD market short-position placers have to abide by the principles of having a price rejection trading trait around the downward trending spot of the 14-day SMA to consider a sell order. Patience has to exercise in the wake of getting that assumption.
The analytics, at a glance, the AUD/USD trade operations may still need to push down a bit purposely to let long-position players have decent buying entries. But, they should be wary of launching more buying orders while the situation portends a bearish-returning outlook around the SMAs afterward.  AUD/USD 4-hour Chart
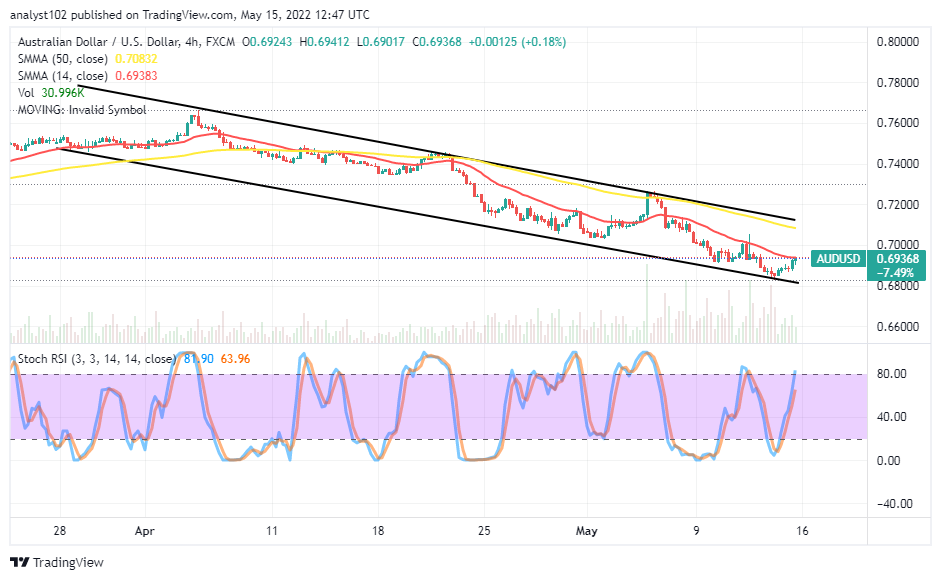
The AUD/USD medium-term chart shows the currency pair market features at a lower trading spot around the trend line of the smaller SMA. The 50-day SMA indicator is above the 14-day SMA indicator. The bearish channel trend lines drew downward to enclose the SMA trading tools. The Stochastic Oscillators are up to around the range of 80, pointing toward the upside direction to indicate an upward momentum gathering is relatively ongoing. A reversal movement leading to having a 4-hour full-bearish candlestick will bring about a downward trend continuation.
Note:Forexschoolonline.com is not a financial advisor. Do your research before investing your funds in any financial asset or presented product or event. We are not responsible for your investing results.


Leave a Reply