AUD/USD Prediction – May 31
The market trending outlook of AUD/USD continues trading sideways around the long-featuring range-bound zones of 0.7800 and 0.7700 levels until the time of writing. There is a 0.26% increment as the pair’s price trades around the value of 0.7728.
AUD/USD Market
Key Levels:
Resistance levels: 0.7800, 0.7900, 0.8000
Support levels: 0.7700, 0.7600, 0.7500
AUD/USD – Daily Chart
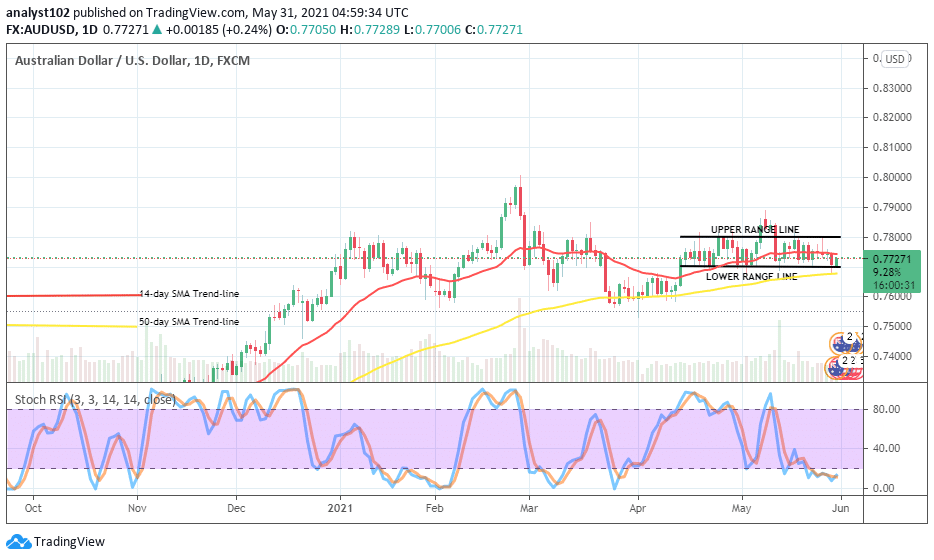
On the AUD/USD daily chart, it is depicted that the currency pair has to prolong in its range-bound trading zones that being kept over several variant sessions. The 14-day SMA trend-line is located in the upper and lower trend lines above the 50-day SMA indicator. A bullish-like candlestick is currently forming against the smaller SMA from below. The Stochastic oscillators are down into the oversold region. But, they appear like trying to open the hairs toward the north close to range 20. That signifies that price stride is somewhat in the making. Does the AUD/USD market tend of breaking out of the ranges soon?
There seems that the AUD/USD has the greater possibility of prolonging its trading stance in or around the values it has kept over time until the next sessions. The trading position remains that both two major market players are only being pushing at an equilibrium capacity around the levels of 0.7700 and 0.7800. But, viewing the trend on a matter of overall scale, it is of getting ups than downs.
The downside analysis of this trade technically has it that the best of taking sell position is at the upper range line of 0.7800 especially when price loses momentum to breach past it further northwardly. Any attempt to follow a less-active downward move around the lower range line is prone to get whipsawed in no time.
In summary, placing of trading positions in the AUD/USD market operations needed to be closely considered. In furtherance, the lower range-line could be decent for a buy entry while the upper range-line could be for a sell entry as long as price lacks volatility.
AUD/USD 4-hour Chart
On the AUD/USD 4-hour chart, it is still recorded that there are persistent range-bound movements in the currency pair market until the present. The 14-day SMA trend-line has only slightly separated below the 50-day SMA indicator in the range-bound trading zones. And, yet, they both point toward the east direction to affirm that sideways trading is ongoing. The Stochastic Oscillators have struggled to swerve northwardly a bit into the overbought region. They appear like lacking the capacity to strongly hold further. However, the 0.7750 is a key resistance line to distinctively give justice to seeing more upsides in the next session.
Note: Forexschoolonline.com is not a financial advisor. Do your research before investing your funds in any financial asset or presented product or event. We are not responsible for your investing results.
Learn to Trade Forex Online
AUD/USD Market Continues Trading Sideways
Footer

ForexSchoolOnline.com helps individual traders learn how to trade the Forex market
WARNING: The content on this site should not be considered investment advice and we are not authorised to provide investment advice. Nothing on this website is an endorsement or recommendation of a particular trading strategy or investment decision. The information on this website is general in nature so you must consider the information in light of your objectives, financial situation and needs.
Investing is speculative. When investing your capital is at risk. This site is not intended for use in jurisdictions in which the trading or investments described are prohibited and should only be used by such persons and in such ways as are legally permitted. Your investment may not qualify for investor protection in your country or state of residence, so please conduct your own due diligence or obtain advice where necessary. This website is free for you to use but we may receive a commission from the companies we feature on this site.
We Introduce people to the world of currency trading. and provide educational content to help them learn how to become profitable traders. we're also a community of traders that support each other on our daily trading journey
Forexschoolonline.com is not a financial advisor. Do your research before investing your funds in any financial asset or presented product or event. We are not responsible for your investing results.

Leave a Reply