Tamadoge Price Prediction – June 26
The TAMA/USD trade pushes in ranges, staging a high swing under the pretense of less actively garnering momentum by the presence of bears’ smaller activities on the crypto economy.
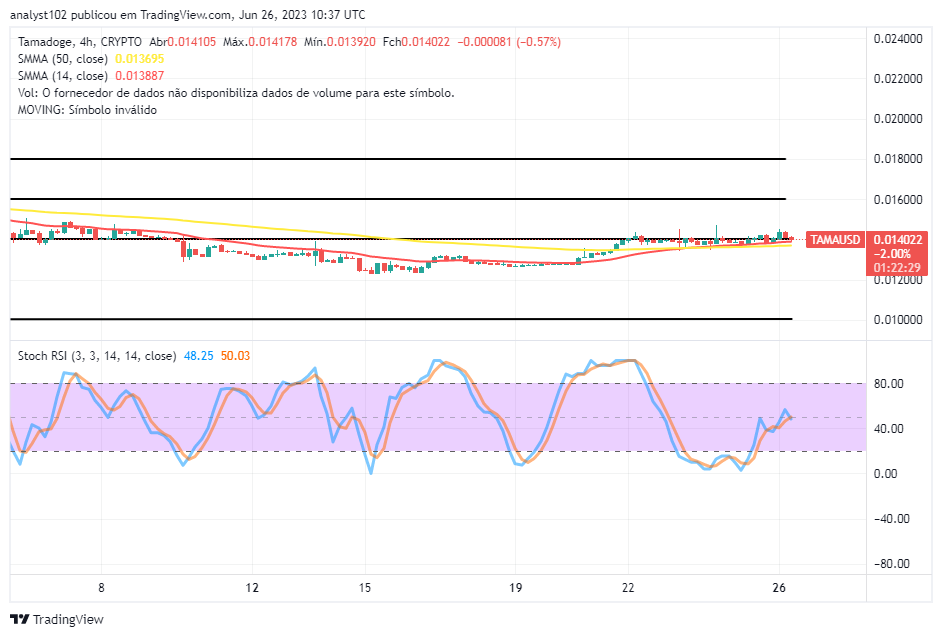
In light of holding that assumption against what sellers might be opting to do in subsequent operations, long-position takers have to be strategic enough by establishing their stances firmly between the trade zones of $0.01400 and $0.01200 values. At the moment of this technical piece, price is exchanging hands between $0.013920 and $0.014178 lines, keeping a minute negative percentage rate of 0.57. The trade decision remains that buyers should continue to hold onto their positions, especially on an investment-based basis.
TAMA/USD Market
Key Levels
Resistance levels: $0.01500, $0.01600, $0.01700
Support levels: $0.01200, $0.01100, $0.01000
TAMA/USD – 4-hour Chart
The TAMA/USD 4-hour chart reveals that the crypto-economic trade pushes in ranges, staging a high swing around the positioning areas of the SMAs.
The pattern of the arrangement between the indicators showcases a kind of baseline, as the 14-day SMA is at 13887, slightly over the $0.013695 point of the 50-day SMA. The Stochastic Oscillators have feebly swerved northbound from the oversold region to place themselves lightly southbound from 50.03 to 48.25 levels. Sellers needed to add more forces to break through the Moving Averages’ points for a sell signal confirmation.
Should buyers and investors liquidate their positions if the TAMA/USD market bears are successful in breaching past the SMAs?
A sudden aggressive breaching of the TAMA/USD market’s 14-day and 50-day SMA trend lines might not sustain a long position through the underlying supports of the $0.01400 as the price pushes in ranges, staging a high swing.
It is still ideally technical to consider that Tamadoge, being an emerging crypto economy, still prices low enough to warrant its worthiness of buying back from the dipping cycle as it has been experienced. Long-position placers needed to trade alongside the reading posture generated between the daily and 4-hour charts, using the 1-hour for executing an entry order. Investors should also stick to the approach of buying and holding on a long-term basis, as it has been envisaged that we are gradually moving into a bullish-running crypto economy cycle.
TAMA/USD 1-hour chart
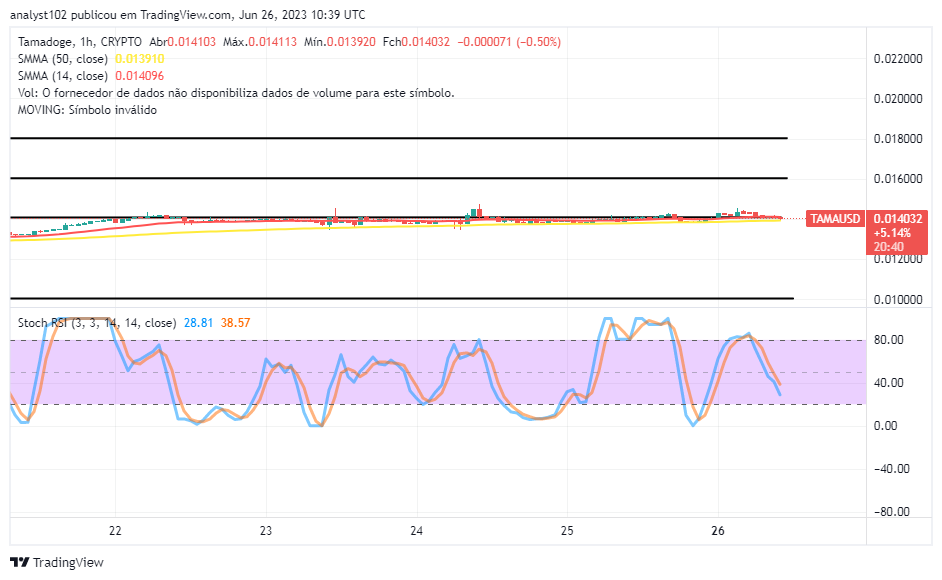
The 1-hour chart showcases the crypto’s trade pushes in ranges, staging a high swing, bordering the closure distance between the trend lines of the SMAs.
The 14-day SMA indicator has continued to push eastward around the 50-day SMA indicator, as they are having so much trouble with the resistance line of $0.01400. The Stochastic Oscillators are in a southbound-crossing mood from around 80 to 38.57 and 28.81. On the short-term trade outlook, sellers are heading toward a reading that will suggest the end of their chance to get more lows soon.
Could you give your mother a P2E explanation? In that case, we created a little crash course.
Could you explain P2E to your mum? If not, we put together a little crash course.
— TAMADOGE (@Tamadogecoin) June 26, 2023
Read our blog about the basics of play-to-earn 👉 https://t.co/n1MbYVUDim pic.twitter.com/SlpaDDicTA
Do you want a coin that would 100X in the next few months? That is Tamadoge. Buy TAMA today
Note: Forexschoolonline.com is not a financial advisor. Do your research before investing your funds in any financial asset or presented product or event. We are not responsible for your investing results.


Leave a Reply