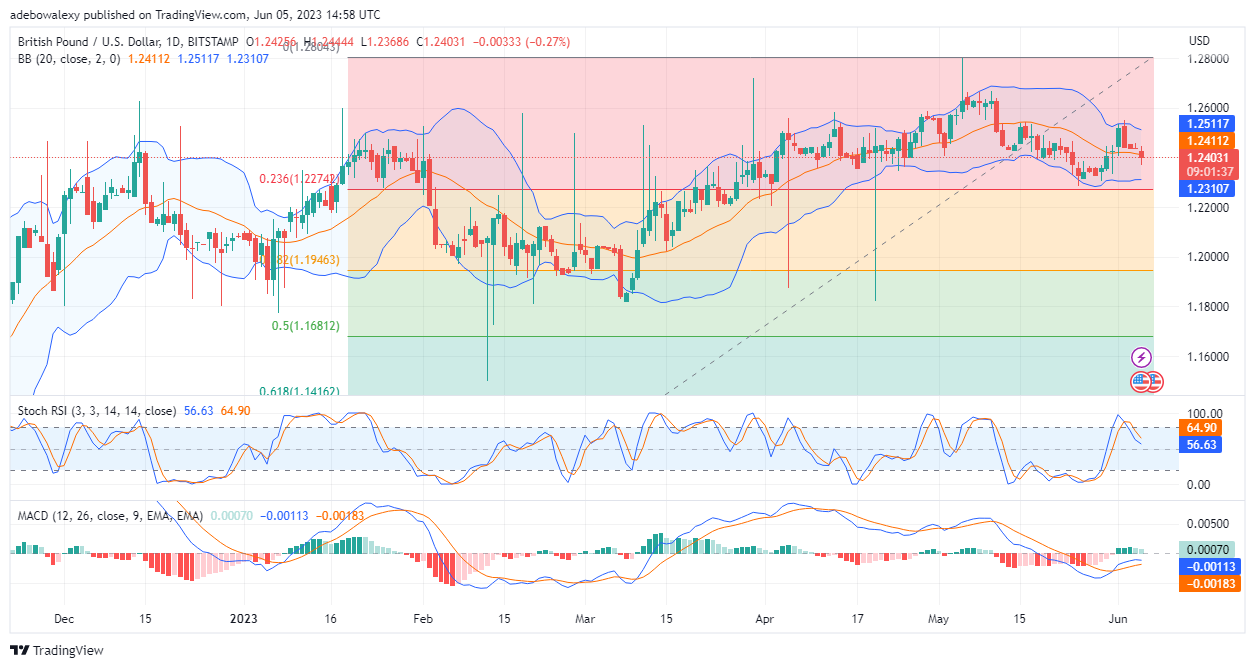
Price action in the GBPUSD poked through the price level of 1.2274 on the 27th of May. Ever since then, price action has been undulating above this price mark. At this point, price action seems to be heading towards support at 1.2311, which is a price level close to the broken resistance level on the 27th of May.
Major Price Levels:
Resistance Levels: 1.2442, 1.2474, and 1.2510
Support Levels: 1.2402, 1.2370, and 1.2340

GBPUSD Eyes Support at the 1.2311 Price Level
The seller has broken support in the GBPUSD daily market at 1.2403. Consequently, this move appears to have effectively unlocked more headwinds for this pair, as more traders will be looking to go short on the pair. The price candle has placed prices below the technical support, and this suggests more downward retracement in this market. Also, the Moving Average Convergence Divergence (MACD) indicator curve can be seen turning towards a bearish crossover above the equilibrium level. In addition, the Relative Strength Index (RSI) indicator is pointing out that sellers are getting the better of market momentum, as it indicates. The lines of this indicator are now near the 50 level; a further decline below this level will indicate a steeper retracement for this pair.

Buyers in the GBPUSD Present a Weak Opposition to Headwinds
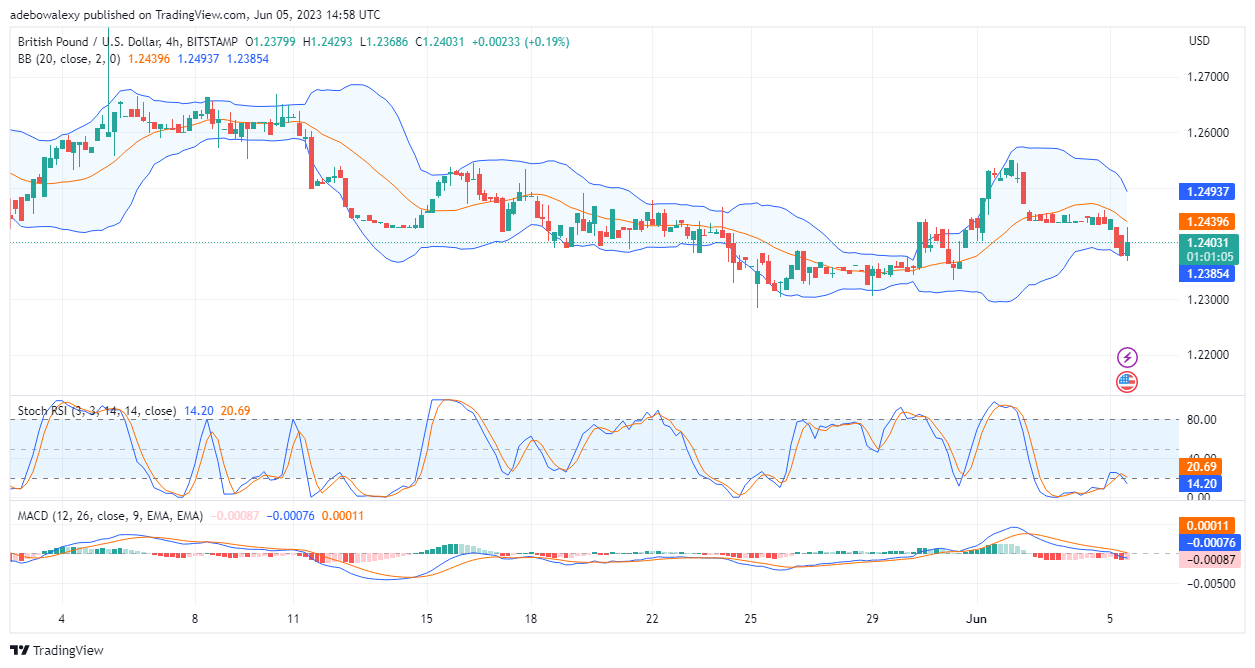
Price activities in the 4-hour market suggest that buyers are trying to resist downward forces. However, trading indicators maintain that bulls are on the losing side. One can see that the RSI indicator curves are still running downward while in the oversold region. Likewise, the MACD curves continue to trend downward below the equilibrium level. However, it should be noted that the recorded gain in the ongoing trading session has caused the bars of this indicator to turn pale red. The majority of indications coming from technical indicators suggest that prices may fall lower toward the 1.2311 mark.
Do you want to take your trading to the next level? Join the best platform for that here.


Leave a Reply