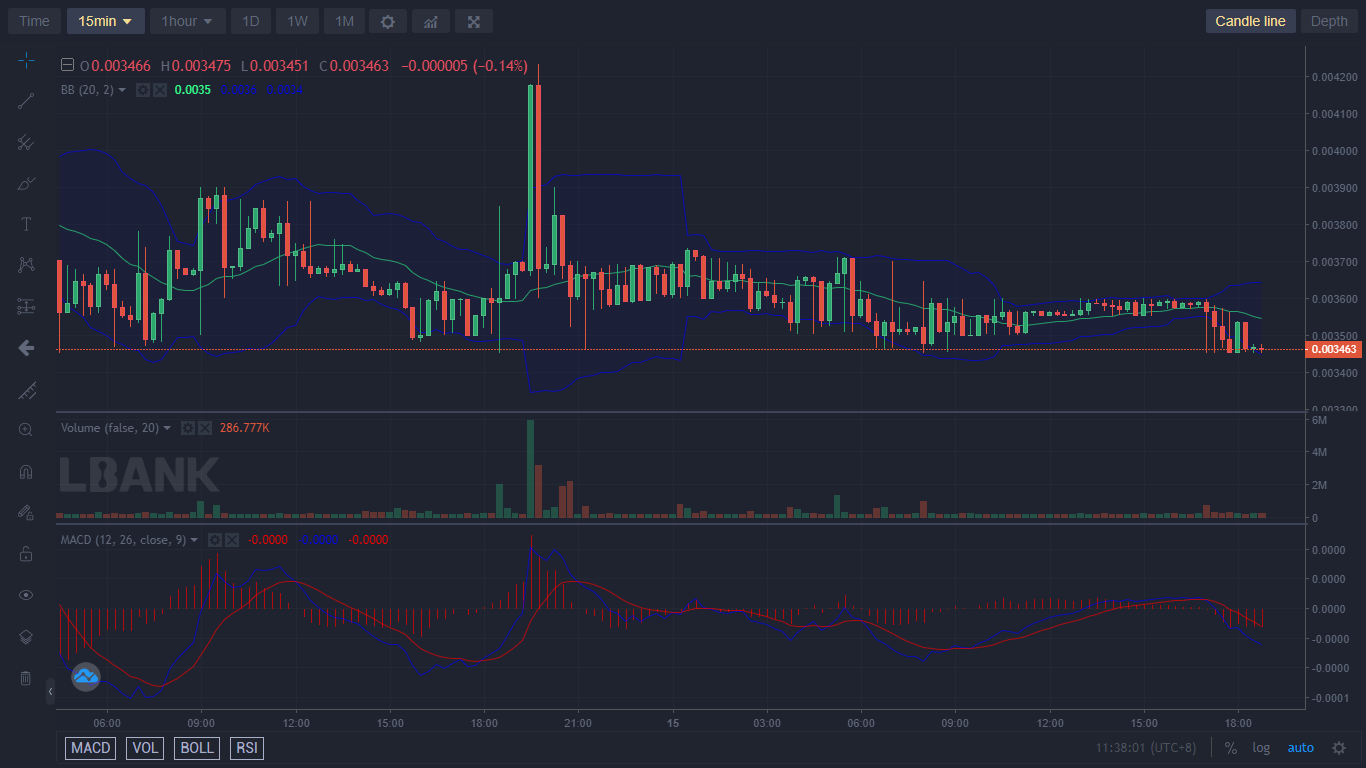
From the outlook of the Bollinger band, we concluded that the price of Battle Infinity may not fall any further from here. In addition to that, the candlestick pattern from the 21st hour of yesterday’s market shows how hard the buyers were trying to resist the downward push of the price by sellers. As a result of this, the price ranged sideways until the 10th hour of today when the price fell to form the $0.003453 support level.
Key Levels
Resistance: $0.003600, $0.003700, $0.003800
Support: $0.003400, $0.003300, $0.003200
IBAT/USD: The Indicators’ Outlook
When the price of a market reached the lower band of the Bollinger indicator, it means that the market will soon retrace an upward price level. This sentiment is even much stronger when the price action breaks below the lower band. If price action breaks below the lower band, it will imply that the price retracement will be much stronger.

IBAT/USD Short-Term Outlook: Bullish Recovery (15-minute chart)
The market price of Battle Infinity fell below the consolidation level late yesterday night and since then it has been trying to seek an upper price level. The RSI line is now trying to cross above the RSI signal line to confirm the bullish price recovery. The same behaviour is reflected in the MACD indicator. The faster line is now ready to cross the slower line. As the bulls and bears battle at this point, the next direction of the market is to the upside.
Want a coin that has a huge potential for massive returns? That coin is Battle Infinity.
Buy IBAT now.


Leave a Reply