AUD/USD Price Prediction – AUGUST 21
There had been long movements in the AUD/USD trade operations before the currency pair price retraces after it failed to stay afloat over the 0.7100 level. The market is between 0.68590 and 0.69195 value lines at an average minute negative percentage rate of 0.57.
AUD/USD Market
Key Levels:
Resistance levels: 0.7000, 0.7100, 0.7200
Support levels: 0.6750, 0.6650, 0.6550
AUD/USD – Daily Chart
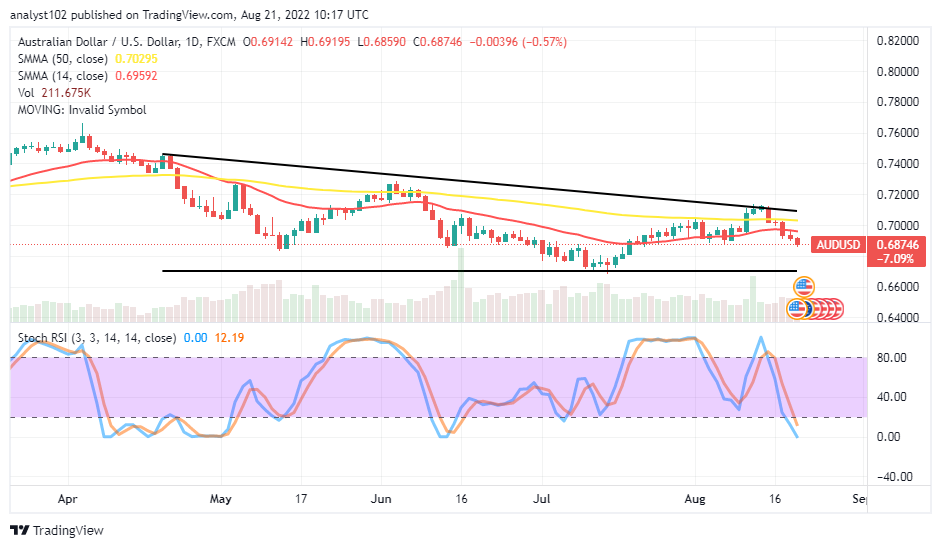
The daily chart pictures that the currency pair market retraces around 0.7100 after a line of higher-surging motions. The bearish trend line drew southward from 0.74641 down to the area at 0.71042, where the price began the retracement move. The 14-day SMA indicator is at 0.695922 beneath the 0.70295 value point of the 50-day SMA indicator. The baseline is drawn at the 0.6700 support level to showcase the overall trading outlook is in a triangular trading shape. The Stochastic Oscillators have dipped into the oversold region, touching the ranges between 12.19 and 0.00. That denotes falling force is on the route of fading off gradually. Has any signal denoted a continuation of corrections in the AUD/USD market operations?
Presently, a bearish candlestick is still in the making, signaling a correction is ongoing below the trend line of the 14-day SMA as the currency pair retraces at the 0.7100 level. It may be taking a while before buyers can gain a decent stance to launch a buying order.
On the downside of the technical, the AUD/USD market sellers are gradually heading toward exhausting their energetic forces as the price is downsizing southward underneath the trend lines of the SMAs. Some declines may still occur with less-active moves to let the trade feature a formation closely over the 0.6700 support baseline.
The analytics, at a glance, it has been observed that the AUD/USD market has reached an oversold reading condition, suggesting that sellers may need to suspend their actions of exerting new sell orders for a while. A rebound, featuring a bullish candlestick at the end may build up a buying wall through which buying orders can achieve. AUD/USD 4-hour Chart
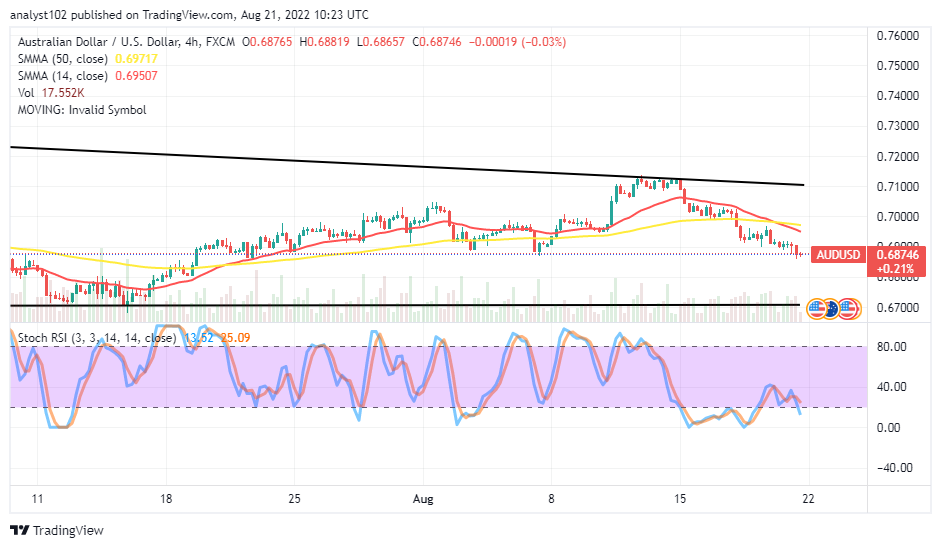
The AUD/USD medium-term chart portrays that the currency pair market retraces around the 0.7100 value line. The 14-day SMA indicator has briefly crossed the 50-day SMA indicator to the downside to keep a lower value line of 0.69507 below the 0.69717 value point of the bigger trading tools. The Stochastic Oscillators are southbound positioned at the range points of 25.09 and 13.52. They are still somewhat pointing southward direction to denote a falling force is ongoing.
Note:Forexschoolonline.com is not a financial advisor. Do your research before investing your funds in any financial asset or presented product or event. We are not responsible for your investing results.
Learn to Trade Forex Online
AUD/USD Market Retraces at 0.7100
Footer

ForexSchoolOnline.com helps individual traders learn how to trade the Forex market
WARNING: The content on this site should not be considered investment advice and we are not authorised to provide investment advice. Nothing on this website is an endorsement or recommendation of a particular trading strategy or investment decision. The information on this website is general in nature so you must consider the information in light of your objectives, financial situation and needs.
Investing is speculative. When investing your capital is at risk. This site is not intended for use in jurisdictions in which the trading or investments described are prohibited and should only be used by such persons and in such ways as are legally permitted. Your investment may not qualify for investor protection in your country or state of residence, so please conduct your own due diligence or obtain advice where necessary. This website is free for you to use but we may receive a commission from the companies we feature on this site.
We Introduce people to the world of currency trading. and provide educational content to help them learn how to become profitable traders. we're also a community of traders that support each other on our daily trading journey
Forexschoolonline.com is not a financial advisor. Do your research before investing your funds in any financial asset or presented product or event. We are not responsible for your investing results.

Leave a Reply