EURUSD Key Levels
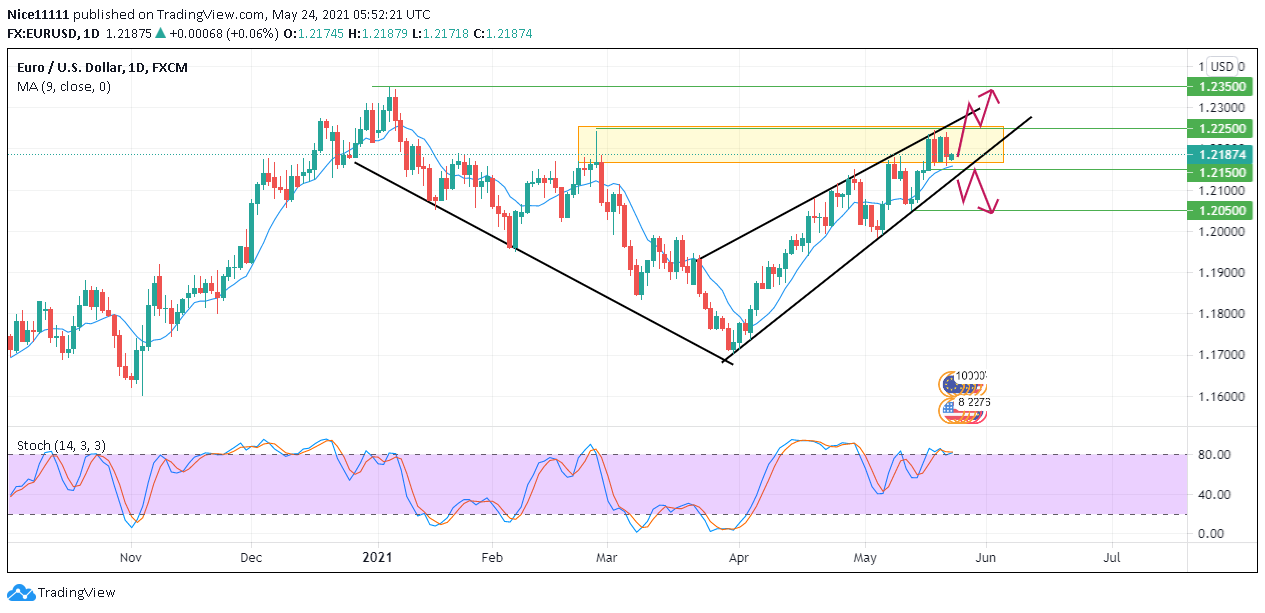
Support Levels: 1.21500, 1.20500
Resistance levels: 1.23500, 1.22500
EURUSD has been bullish on the market. A rising wedge pattern has been formed on the market. The upward trend of EURUSD is faced with resistance at 1.22500. The resistance has a zone that has been successful in defending. This is seen as four large candles align side by side on the daily chart. The consolidation shows an accumulation of orders getting ready for an expansion.
 Market Expectation of EURUSD
The Stochastic lines are in the overbought region getting ready for a sell on the daily chart. This may cause an expansion on price breaking through the rising wedge below for a sell. The sell would likely reach for 1.20500 support level.
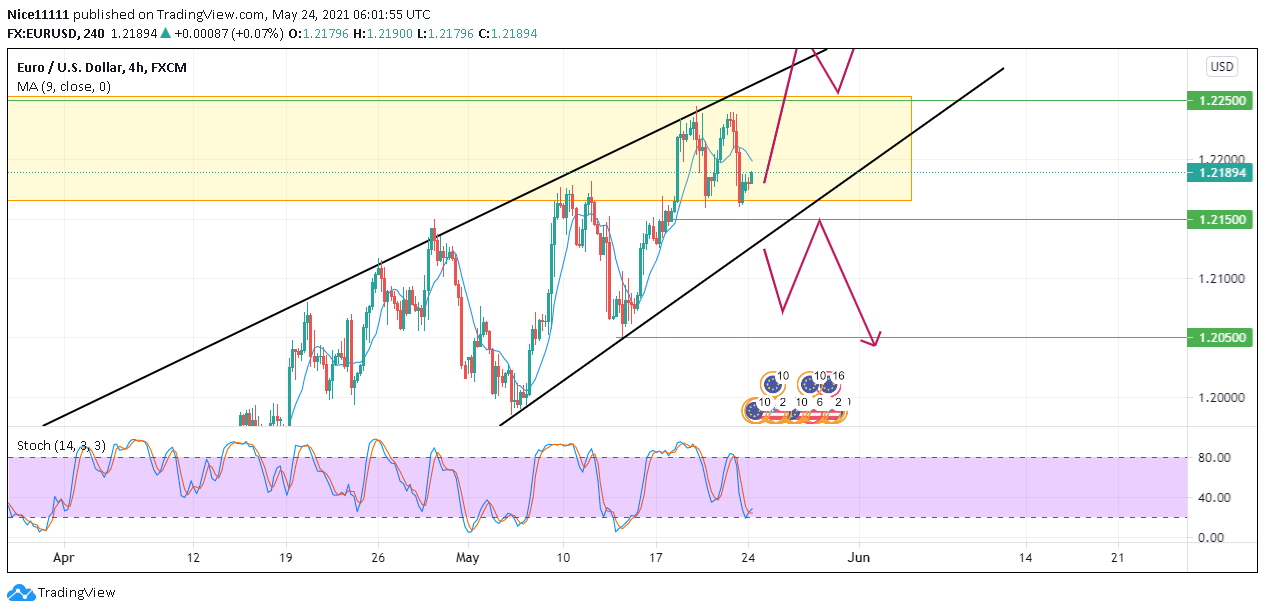
The 9 Moving Average is currently below the candles acting as support on the daily chart. The price of EURUSD might eventually break through the resistance zone to aim for 1.23500. On the four-hour chart, a double top is seen to have formed which is a bearish pattern.
The moving average on the daily chart has switched position to the upper side of the candle showing signs of bearishness.
The stochastic on the four-hour chart is slightly above the oversold region. Its lines have crossed and it is showings signs of a buy.
The current indecision of the market is due to the present consolidation seen on the daily chart. As orders are being accumulated it is advisable to seek clear signs of a break out higher or lower. Entries of trade can be made on a retest of the consolidation area.
Note: Forexschoolonline.com is not a financial advisor. Do your research before investing your funds in any financial asset or presented product or event. We are not responsible for your investing results.


Leave a Reply