AUD/USD Prediction – May 17
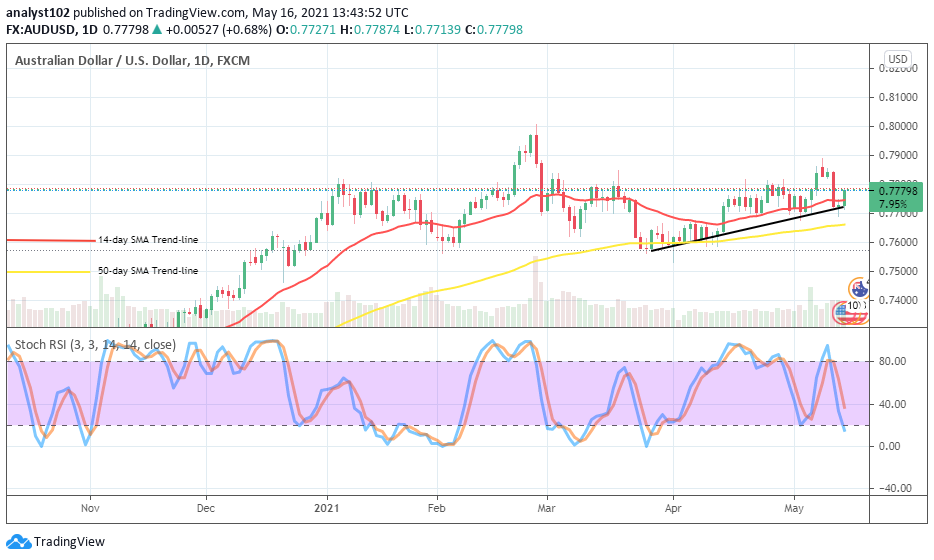
Initially, the market valuation of AUD/USD witnessed a high closely underneath the point of 0.7900 before it lost the momentum to the downside to touch support around 0.7700. Currently, price makes a slight rebound to trade closer below the point of 0.7800 at a 0.68% increase.
AUD/USD Market
Key Levels:
Resistance levels: 0.7900, 0.8000, 0.8100
Support levels: 0.7700, 0.7600, 0.7500
AUD/USD – Daily Chart
It is revealed on the AUD/USD daily chart that the market valuation has reversed against its uptrend path to find support around the level of 0.7700 on May 13th day’s trading time. The bullish trend-line is drawn in a supportive instrument to the smaller SMA that is located around the level of 0.77000. The 50-day SMA indicator is underneath the 14-day SMA trend-line as they slightly point to the north. The Stochastic Oscillators are almost into the oversold region. They now seemingly attempting crossing around range 40 back to the north as a candlestick has appeared stemming to the upside already. Will the AUD/USD 0.7700 line now serve as a baseline?
Considering a baseline for an uptrend return of this market presently, the AUD/USD bulls will have to hold stronger in their pushes against the downside off from the support level of 0.7700. Like in the recent past, the major resistance trading zone militating against the bullish trend continuation of this fiat-currency pair is still at the level of 0.7900. A bullish candlestick needed to form against the line to signal an actual return of the upswing.
On the contrary, a less-active price action made in the market toward the 0.7900 immediate resistance point will most likely see it testing or trading around it featuring a line of variant higher lows that may lead into a range-bound trading situation. However, with a long hold against a further uptrend movement at that zone, bears may easily decide to take up the market control once again.
Summarily, the AUD/USD market operation has lowered down trading at the level of 0.7700 to find support. And, at that level, that point is expected to be the key zone that current moves should be in the favor of upsides. Therefore, it should as well serve as the strong line against more sustainable downsides. AUD/USD 4-hour Chart
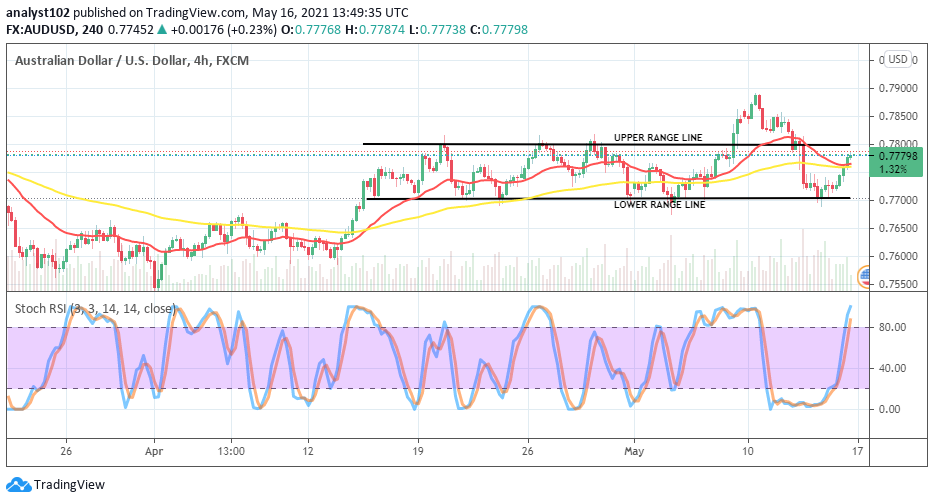
The AUD/USD medium-term chart has shown that the currency pair has returned into its range-trading levels of 0.7700 and 0.7800. The market fell back into the range zones on May 12 to touch the lower point. But, it is now gradually rebounding closely towards the upper line. The 14-day SMA closely bent near the top of the 50-day SMA indicator attempting to cross back to the north to suggest a return of an uptrend move. The Stochastic Oscillators are now in the overbought region briefly pointing to the north. That suggests the possibility that the base currency will push further in the next session as paired with the US Dollar.
Note: Forexschoolonline.com is not a financial advisor. Do your research before investing your funds in any financial asset or presented product or event. We are not responsible for your investing results.
Learn to Trade Forex Online
AUD/USD Value Trades Below the Line of 0.7800
Footer

ForexSchoolOnline.com helps individual traders learn how to trade the Forex market
WARNING: The content on this site should not be considered investment advice and we are not authorised to provide investment advice. Nothing on this website is an endorsement or recommendation of a particular trading strategy or investment decision. The information on this website is general in nature so you must consider the information in light of your objectives, financial situation and needs.
Investing is speculative. When investing your capital is at risk. This site is not intended for use in jurisdictions in which the trading or investments described are prohibited and should only be used by such persons and in such ways as are legally permitted. Your investment may not qualify for investor protection in your country or state of residence, so please conduct your own due diligence or obtain advice where necessary. This website is free for you to use but we may receive a commission from the companies we feature on this site.
We Introduce people to the world of currency trading. and provide educational content to help them learn how to become profitable traders. we're also a community of traders that support each other on our daily trading journey
Forexschoolonline.com is not a financial advisor. Do your research before investing your funds in any financial asset or presented product or event. We are not responsible for your investing results.

Leave a Reply