Weekly Price Action Trade Ideas – 1st to 5th July
Markets Discussed in This Week’s Trade Ideas: EURUSD, GBPUSD, AUDJPY and CHFJPY.
GBPUSD Daily and 4 Hour Charts
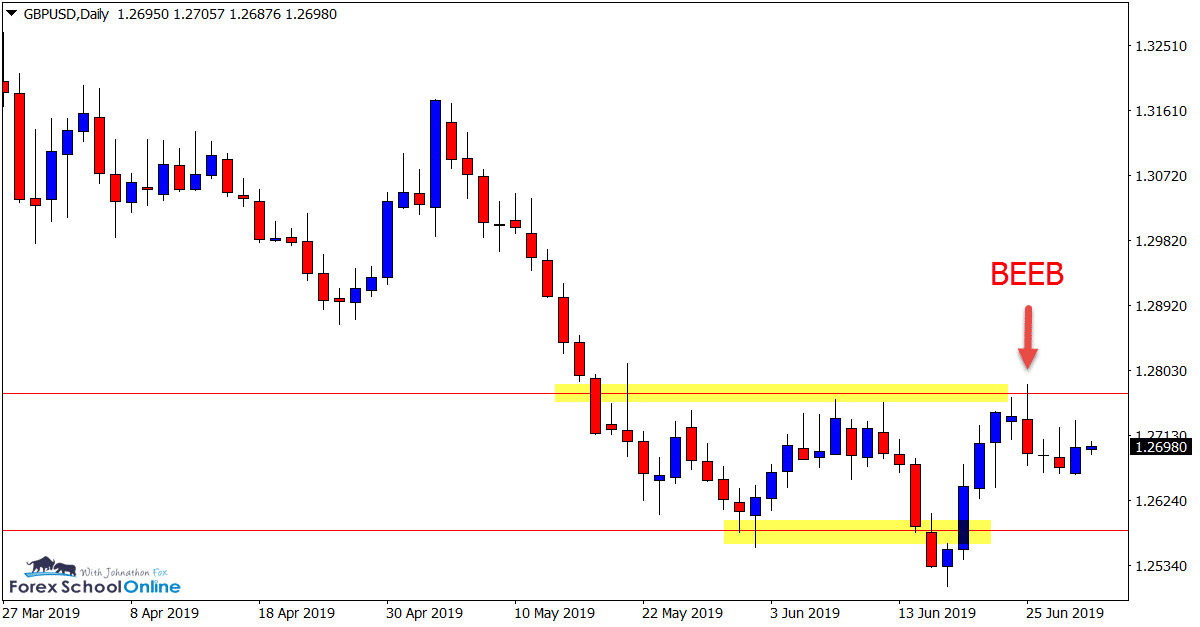
Bearish Engulfing Bar Inside Box
Price on the daily chart of the GBPUSD has formed a Bearish Engulfing Bar.
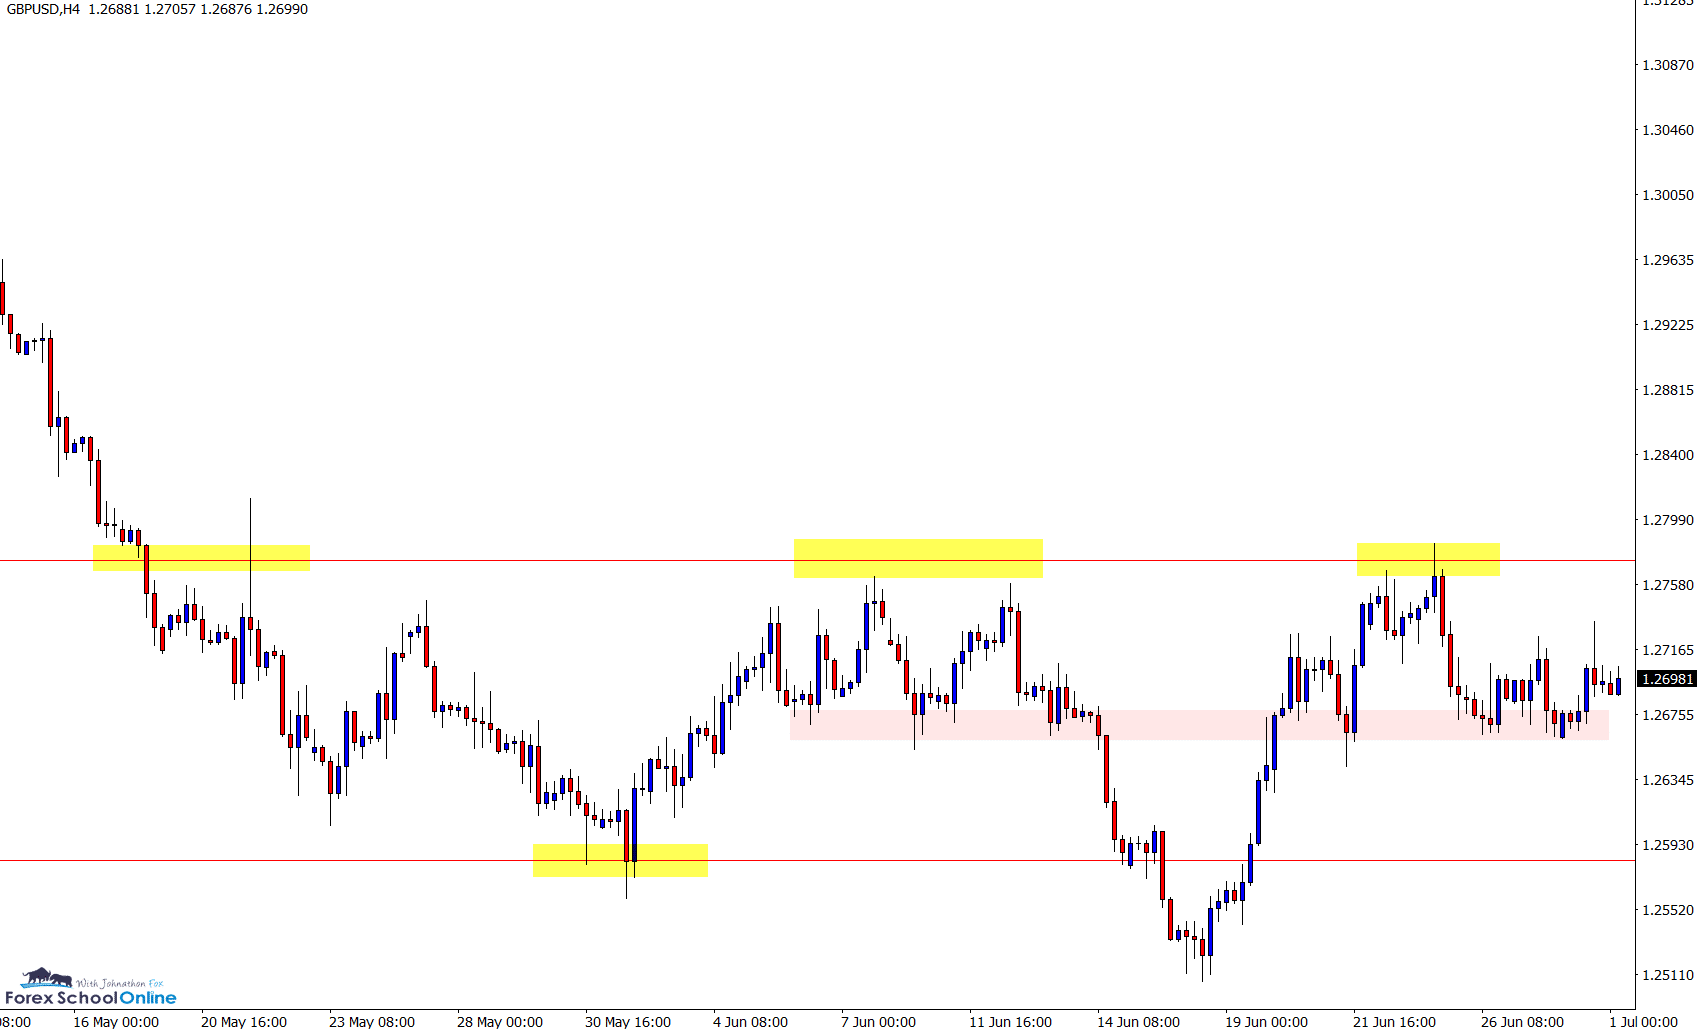
Whilst a solid enough engulfing bar and formed rejecting a resistance level, it is sitting on a minor support level that could hold up the move lower.
If price can successfully break this minor support, then a move into the next daily swing level could occur quickly.
Daily Chart
4 Hour Chart
AUDJPY Daily and 4 Hour Charts
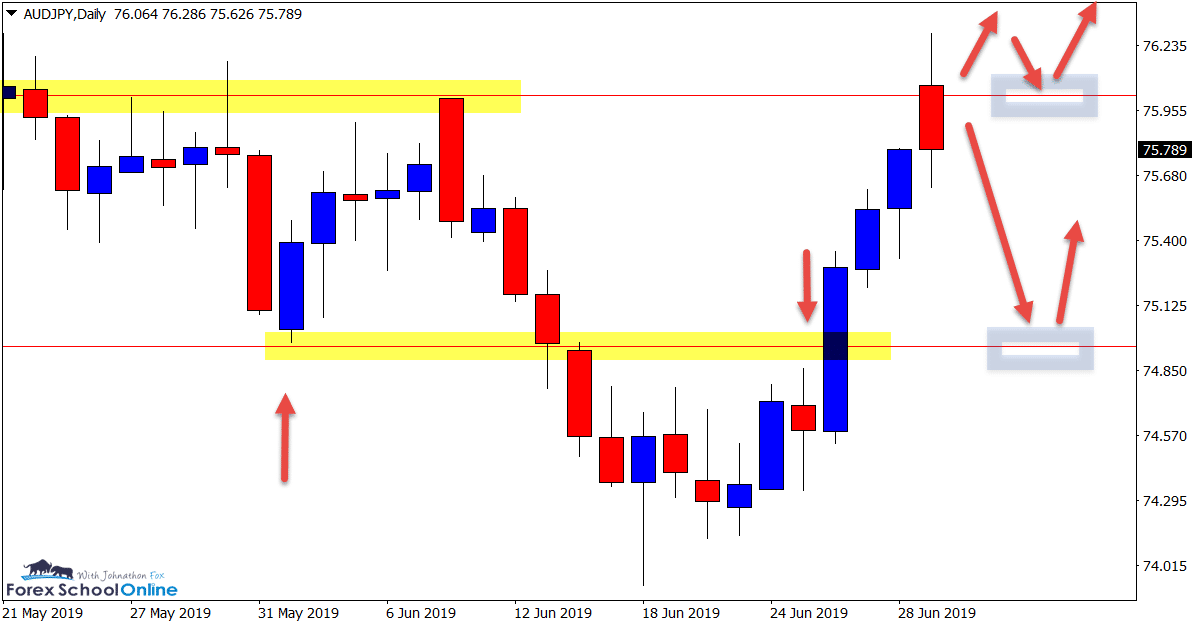
Now Testing Daily Resistance
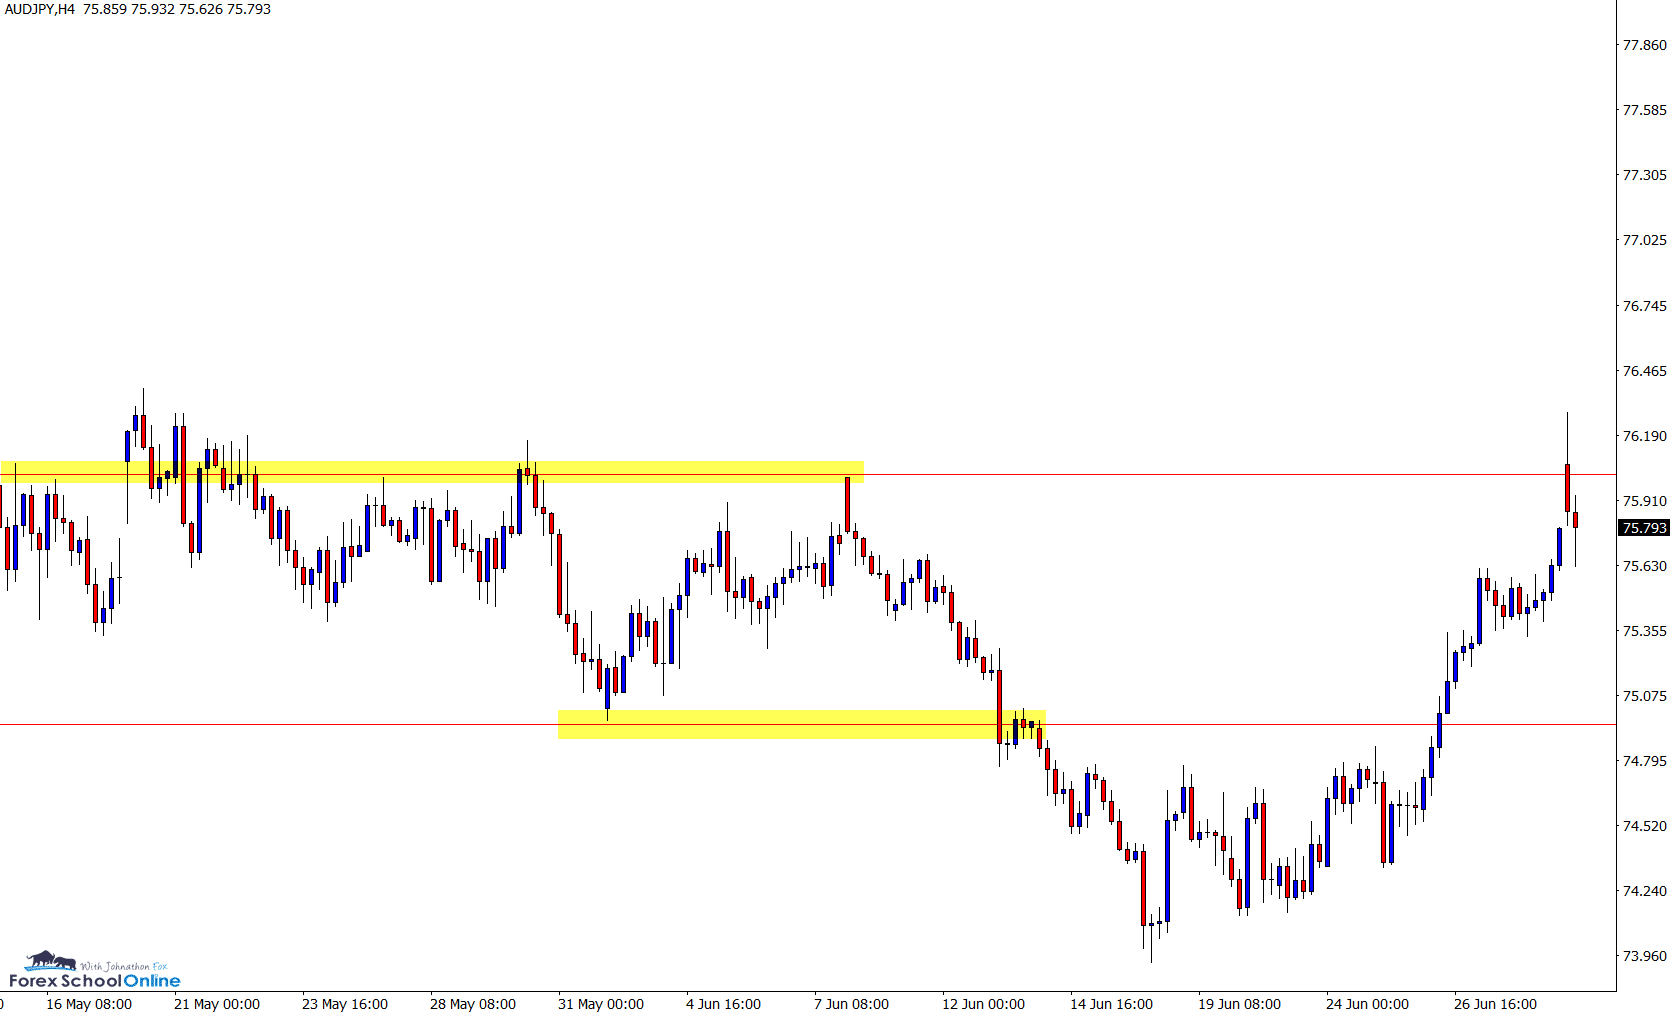
Price on the daily chart of this market is testing the recent key resistance level.
This level has held as a solid level in recent times, and we have also had a large move lower, but we are also seeing some small signs of a reversal back higher.
Aggressive traders could watch this market to see if the reversal plays out with either a breakout through the resistance and look for breakout and retest trades.
The other possibility is to watch for a pullback into the daily level where price recently found support and watch for bullish A+ trigger signals.
Daily Chart
4 Hour Chart
EURUSD Daily Chart
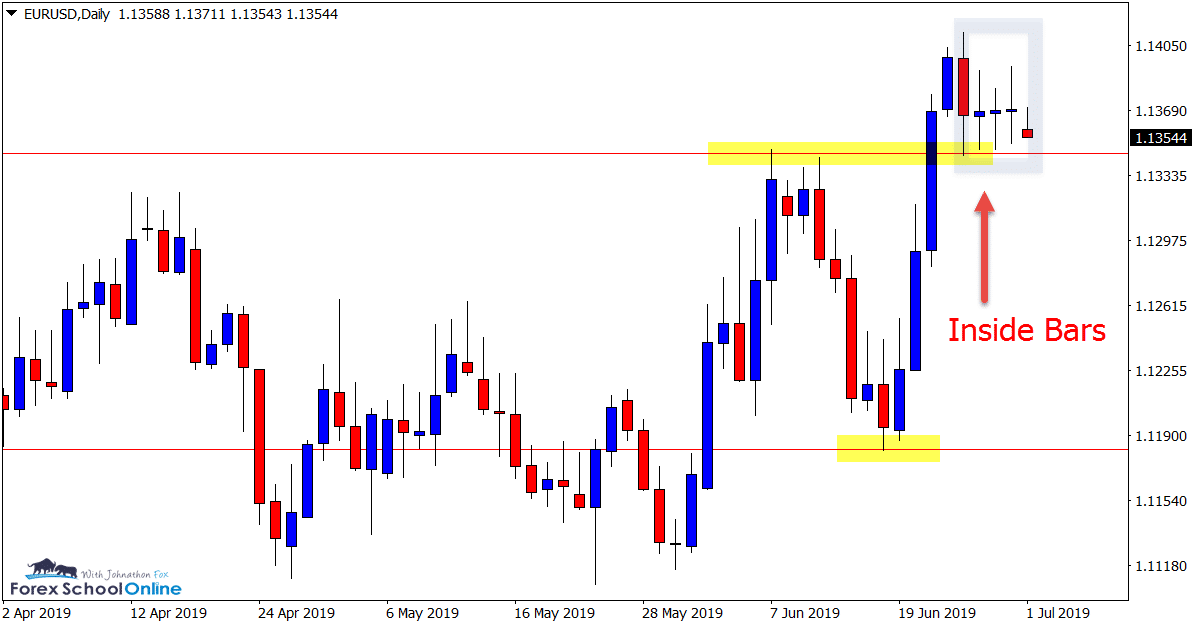
Inside Bars on Daily Support
Price action on the EURUSD has been trading sideways in a ranging choppy market for the last 12 months.
After the large sell-off to start 2018, price has since moved sideways chopping back and forth and not really going anywhere. The daily chart illustrates this the best with price now at a level it was 11 months ago.
Of course there have been trading opportunities within this sideways movement, but with a market so choppy it can make things tricky.
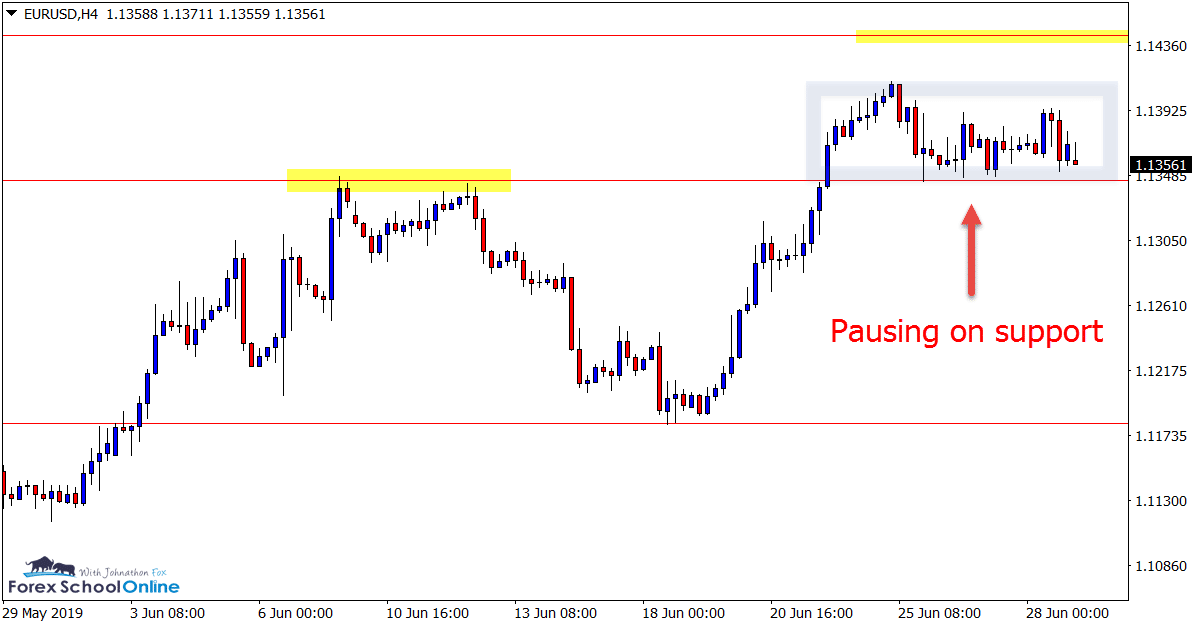
We can see now that price is above the most recent price flip support level and has formed an engulfing bar followed by a series of inside bars.
Which way price breaks out of the engulfing bar could be crucial.
Daily Chart
4 Hour Chart
CHFJPY Daily Chart
Test of Recent Momentum
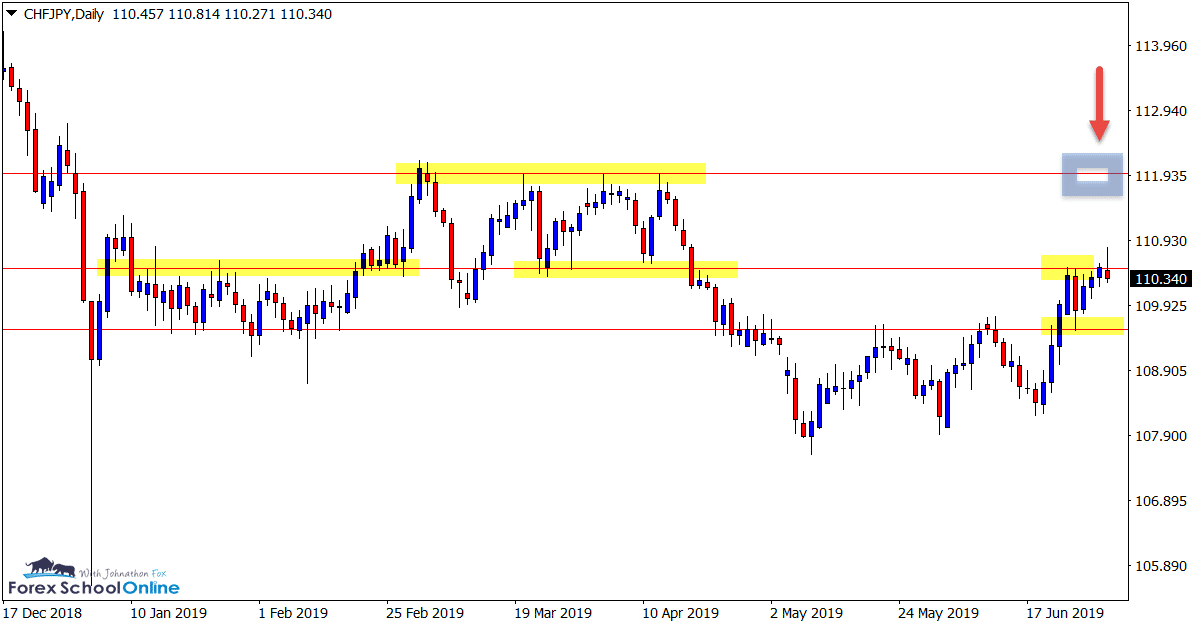
Price on the daily chart of the CHFJPY is now testing a crucial resistance level.
This level has in recent times held as both a support and resistance level, but we are seeing signs of price reversing back higher with momentum.
On the daily chart we have had a series of higher highs and higher lows before this crucial resistance level test.
If price does break and move higher, there looks to be space to make a solid move into the next major resistance level shown on daily chart below.
If the level holds, then the near term support comes in close below for possible bullish trigger signals.
Daily Chart
Note: We Use Correct ‘New York Close 5 Day Charts’ – You can read about why we use these and how to download the correct free charts at Correct Free New York Close Demo Charts
Trade Ideas Note: All views, discussions and posts in the ‘charts in focus’ are the view of Forex School Online and are not recommendations or trading advice. All posts are general in nature and are not advice to buy or sell.
Please leave questions or comments in the comments section below;


Leave a Reply