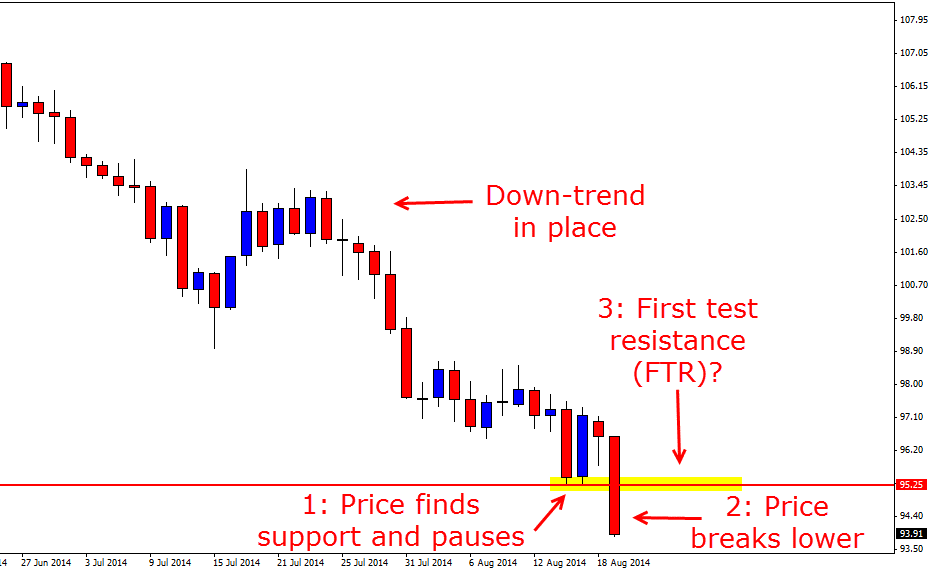
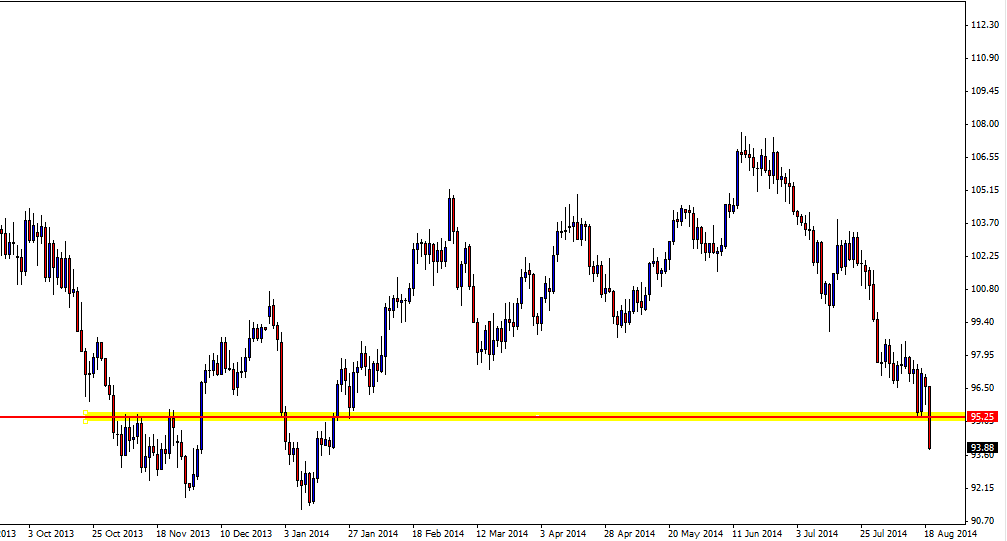
The WTI Light Crude Oil market has overnight seen it’s price collapse to lose over $2.50 in the one daily session. This major fall can be seen on the daily chart below. During this fall price moved lower and closed beneath a key daily support level. Once price moved through this support level, price gained momentum and price fell away much lower to be now sitting at a seventh month low.
This move lower was in-line with the recent down-trend that this market has been in. Price in recent times has been making steady lower highs and lower lows with price either rotating back higher or stalling before making the next leg lower. This major move lower through support could now present the next opportunity for price action traders to hunt for trades on their intraday charts.
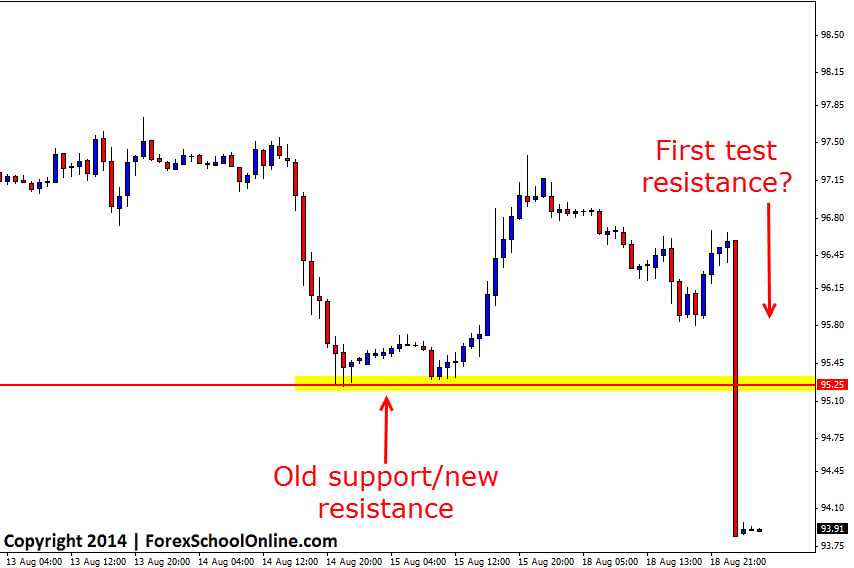
Traders could look for this trend to continue with any signs of strength, potential short selling opportunities to join the recent strong momentum lower. If price can now rotate back higher and into the old support area that price has just crashed through, it may look to act as a price flip area and traders could look for that area to act as a new resistance. As I explain in the trading lesson Taking High Probability Trades at The First Test Support/ Resistance if price does move back into the price flip, traders can watch closely for price action clues to see if any bearish price action presents on their intraday charts for a potential short trade.
As the 1hr chart shows below; this new potential price flip resistance area could act as a solid area to target short trades using the First Test Resistance (FTR) method if a quality price action trigger signal presents.
Daily WTI Chart

Daily WTI Chart – Zoomed Out

1 Hour WTI Oil Chart

Related Forex Trading Articles & Videos
– Why Pro Traders Accept Uncertainty in Their Trading and Why You Should Too!


Leave a Reply