The US 30 or Dow Jones is once again moving back higher and into the major daily resistance level to potentially look at breaking higher and once again into all time highs.
As I have covered heavily in this Forex blog on multiple occasions in the recent months, the US 30 has been one of the strongest markets in the world over the last 18 months coming off a base of around the 12500.00 level to roar higher to now sit around the 18277.00 mark.
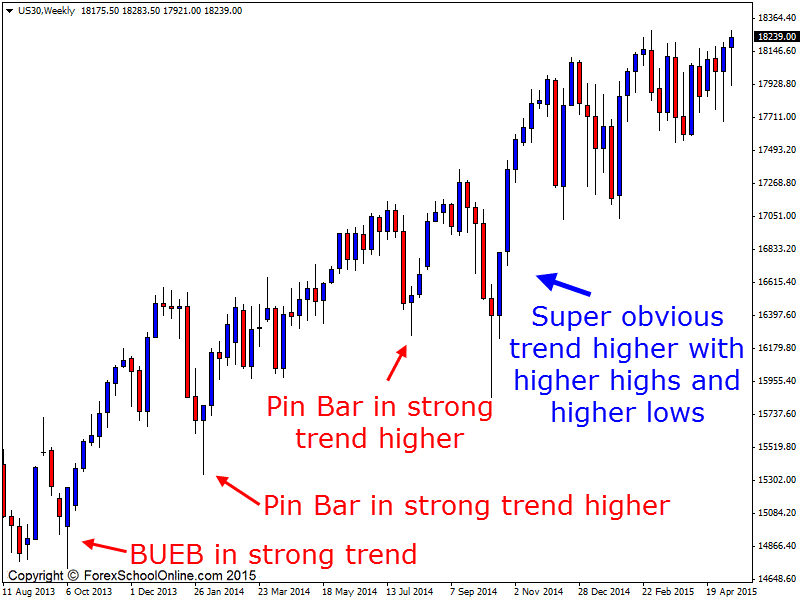
During this huge move higher, price has made multiple new all time highs, each time pushing higher and breaking the previous limit. As the weekly chart shows below; this strong move higher has created a super strong trend and for those price action traders on the ball there have been really obvious high probability chances to take full advantage.
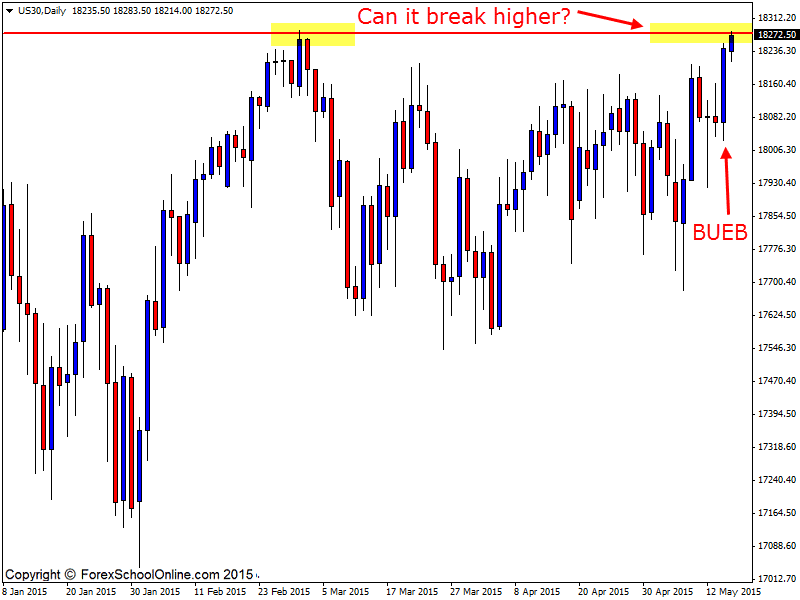
Price on the daily chart has now formed a Bullish Engulfing Bar (BUEB) that has pushed price higher and into the major daily resistance level. What is going to be key is watching how the price action behaves at the major daily resistance. In particular, to see if price is rejected or if price can break through and close out and above making a new high.
If price can break out and close higher this could present with a solid opportunity for traders to start hunting long setups with the strong momentum higher. Traders would need to watch the daily resistance and price action to make sure that the resistance had “flipped” so that if price did make a re-test of the level they could hunt long trades at the new support level.
NOTE – HURRY ONLY ONE DAY LEFT: There is less than one day left to enter the competition if you want to win your very own Forex Tester 2 Back-Tester. All you have to do is enter your email. That is it and you could win!
US 30 Weekly Chart

US 30 Daily Chart

Related Forex Trading Education
– The Exact Markets & Forex Pairs Johnathon Fox Trades & Why


Leave a Reply