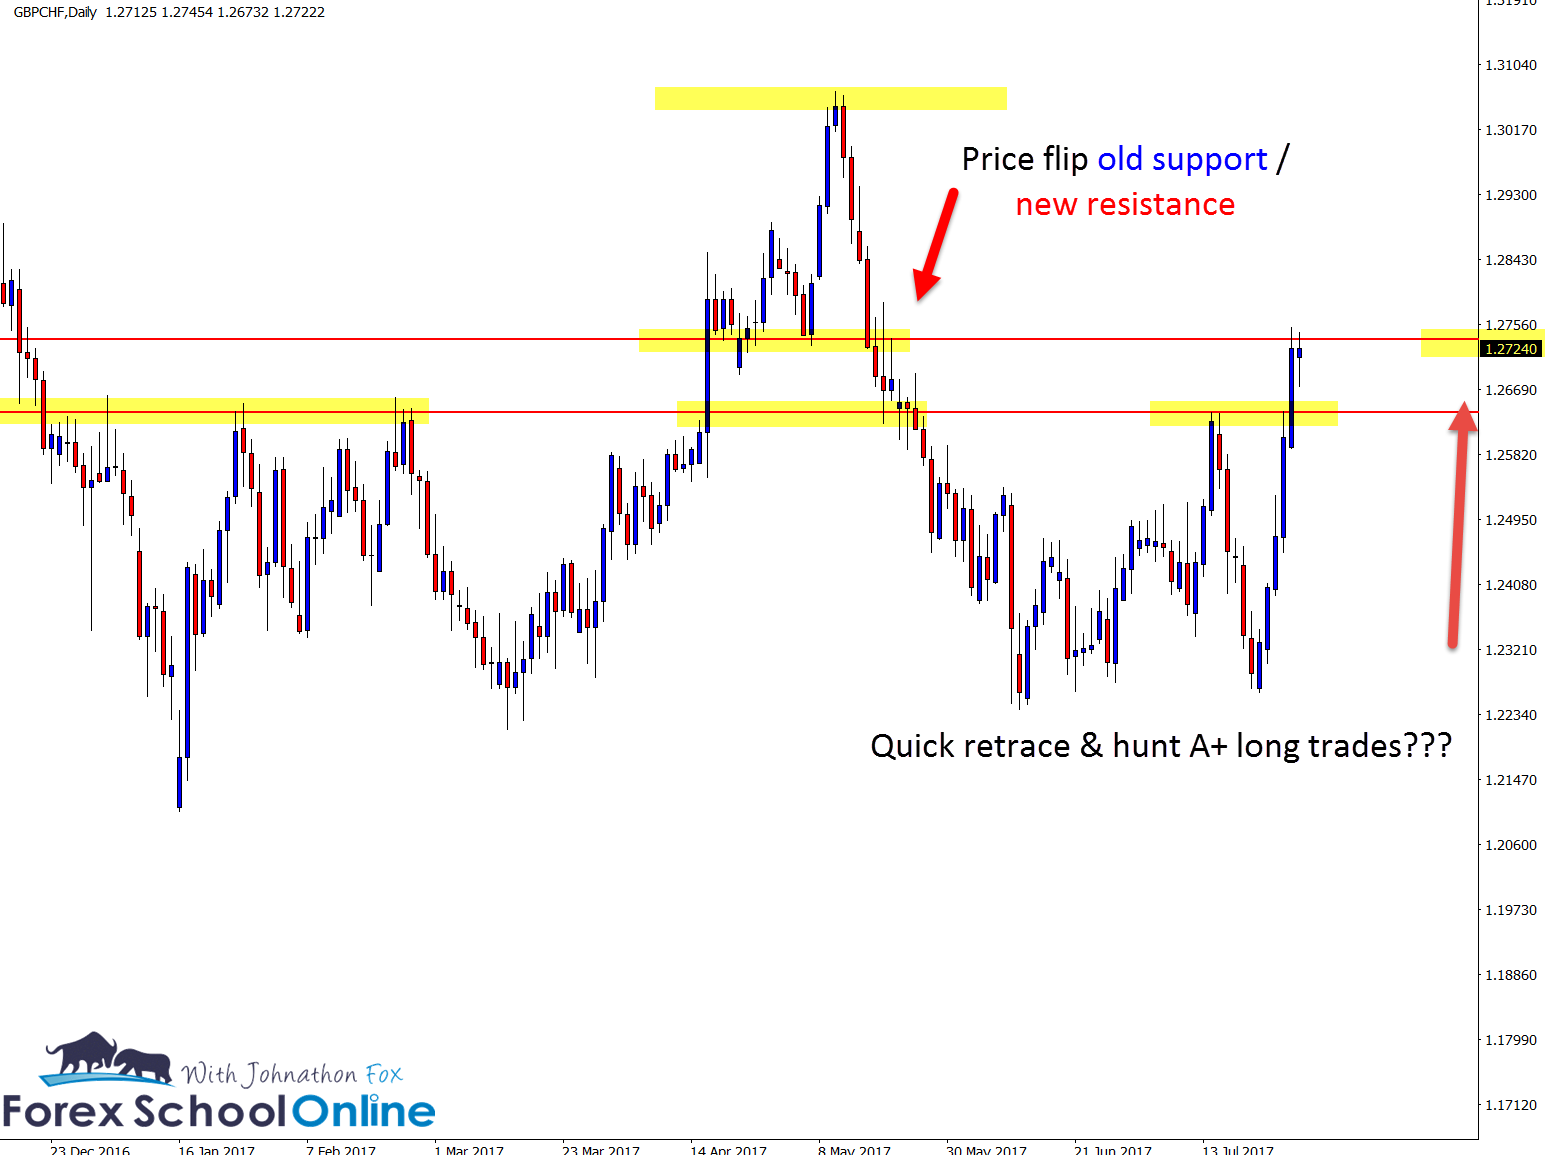
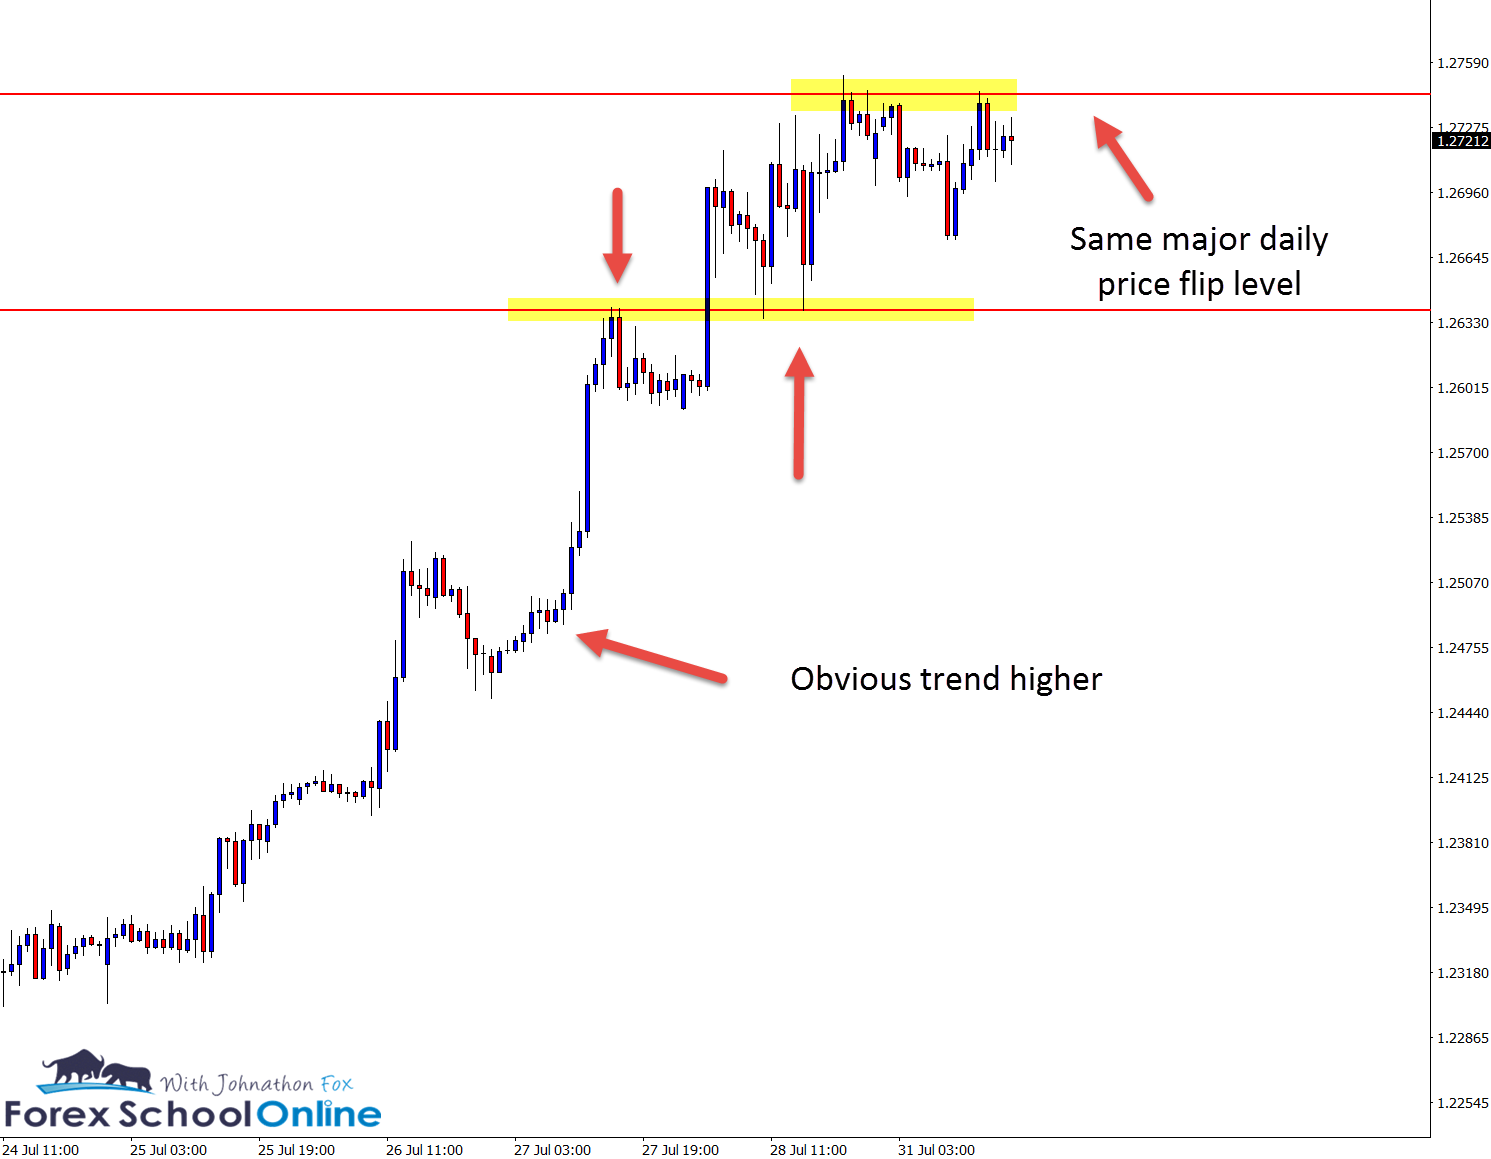
Price action on the GBPCHF daily chart has moved into a major resistance level and is making a test to break through the level as I create this post for you now.
Price has smashed higher in this past week with five consecutive higher closes on the daily chart, starting this move from the major support lows.
If you move to your own daily GBPCHF chart and take a look at the support that price has just moved off, you will see just how important the level is that price has started this move from.
That support has been a proven level going back years. However; it was surprising to see price move so quickly and with so much power like it is has done.
So what does price do now and what do we do?
Now that price is making this test at the major resistance and price flip level it depends on what price action does from here…
It is far more favorable to trade long and bullish at this current stage for a few major reasons;
- The recent strong momentum.
- We have a close major support trouble area back lower and if we make short trades we would be trading back into this which could be a problem.
- If price can break higher it opens a lot of space and potential for A+ trade setups.
Space Higher Overhead
If price breaks higher it means we can look for potential A+ trigger signals to get long.
How?
Using the strategy I have discussed in here at First test of Support or Resistance Price Action Trading Strategy
After price moves out higher and above this resistance, we can look for the first test back into the old resistance and / new support to make an A+ trigger signal to get along with the momentum higher.
See charts below and read that lesson HERE.
Post your questions in comments below.
GBPCHF Daily Chart

GBPCHF 1 Hour Chart


Leave a Reply