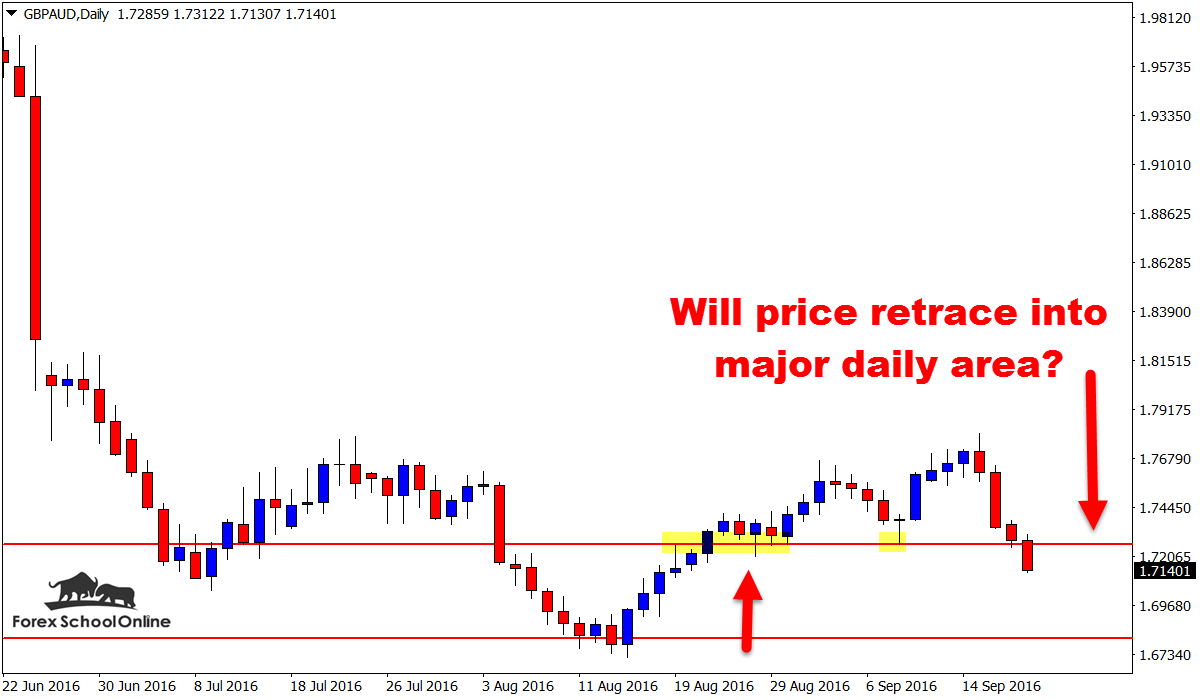
Price on the daily price action chart of the GBPAUD has broken lower and through a major price flip support level.
As soon as price broke this level it started to gain momentum and I am sure you can see on your charts, both on your daily and also intraday charts that if price can continue this move and momentum there is a long way to fall for this pair.
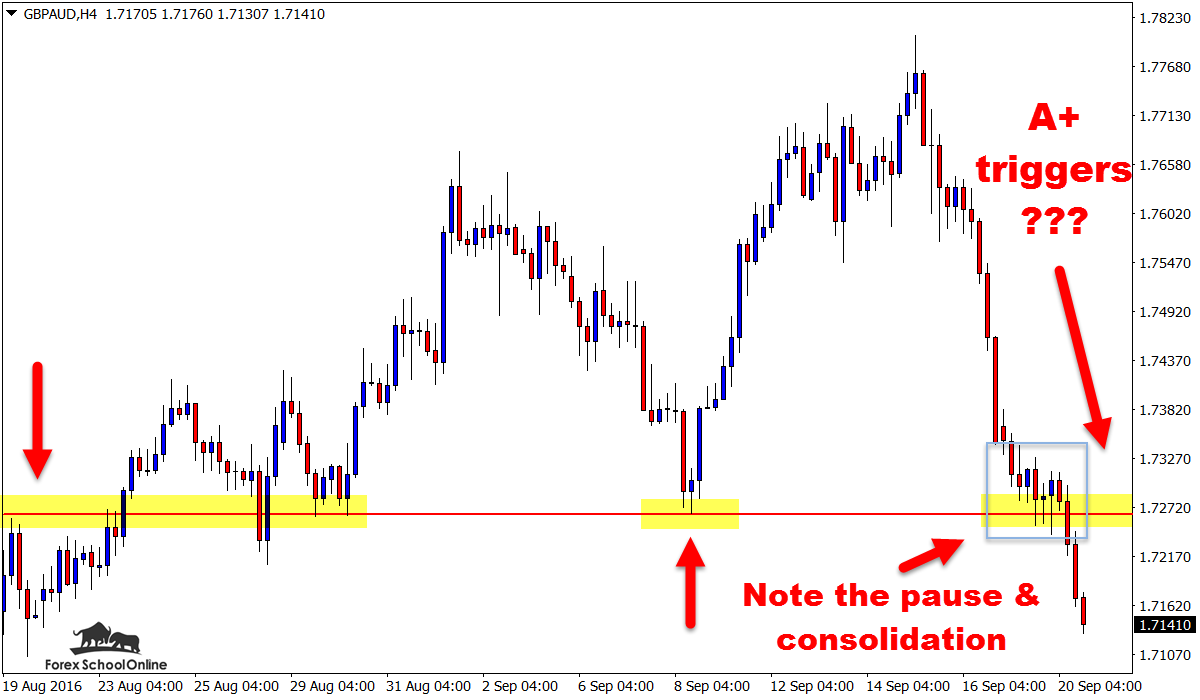
That is what first got me interested when I flicked over to it. I noticed that price had started to breakout and that there was a lot of space. What was also super interesting and you will see on the 4 hour chart below is that just before breaking lower price paused and consolidated and then broke through.
This is a key bit of information and could be really important if price now makes a retrace back higher and back into the old support / new resistance price flip level. Now that price has made the move lower we could potentially look to trade with this momentum in our favor.
Trading with this breakout, especially on the intraday charts such as the 4 hour chart or even lower would be trading with the trend and momentum in our favor. You only have to flick over to the 1 hour chart to see just how strong the breakout trend and momentum is.
I discuss how you can not only use strategies like the 1,2,3 reversal, but use the trend to make high probability trades in the trading lesson;
How to Trend Trade Price Action | In Depth Tutorial
If we look to hunt short trades, not only would we be trading with the trend and strong momentum, but we would also be trading from a proven daily price flip level.
To confirm any potential high probability trade setups we would need to have a bearish trigger signal that confirms the price action story and the market move.
Daily GBPAUD Chart

4 Hour GBPAUD Chart

Related Forex Trading Education


Leave a Reply