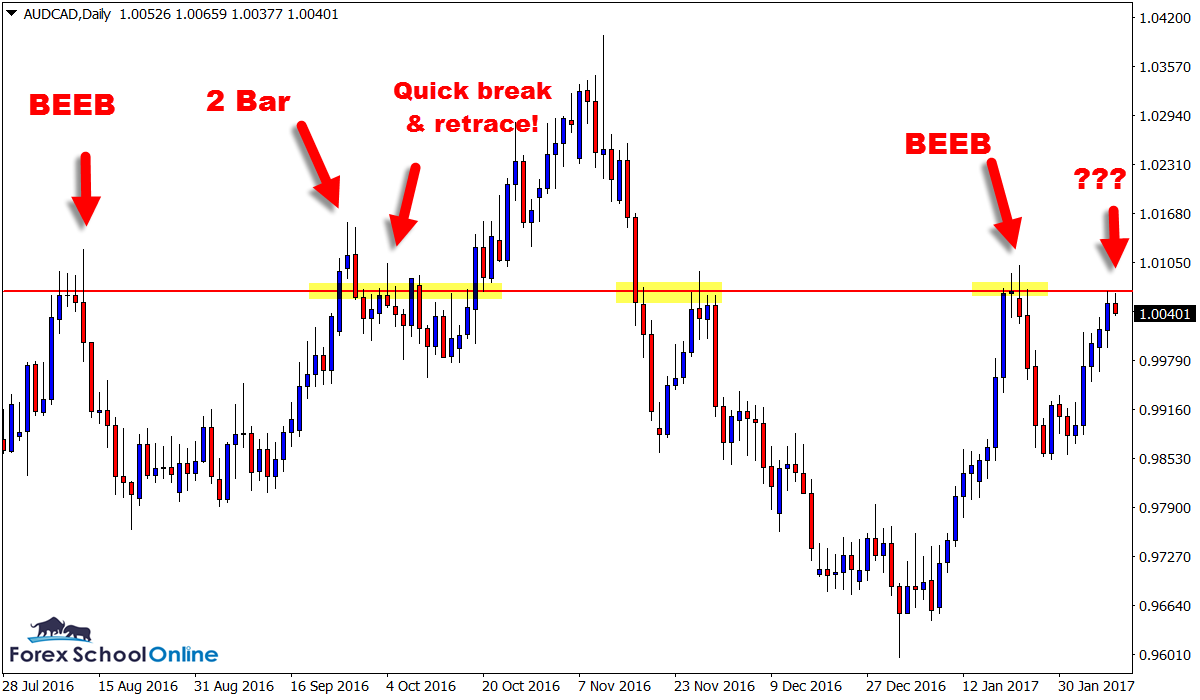
The Daily price action chart of the AUDCAD is a heaven of trigger signals of late, forming rejection price action setups rejecting the major price flip level.
As my first chart below highlights for you; price has rejected this level and also formed solid price action triggers such as Bearish Engulfing Bar setups = BEEB’s.
What is super interesting however is that; how we can just keep using these same major – obvious & clear as day levels over and over again.
If you mark this same level out on your chart, and then zoom right out, you will see that this level is a price flip and a proven support and resistance level going back years.
I have a tutorial on how you can mark the best price flips and also how to use them to find trades here;
High Probability A+ Price Flip Levels
Price has now moved higher and back into the exact same level.
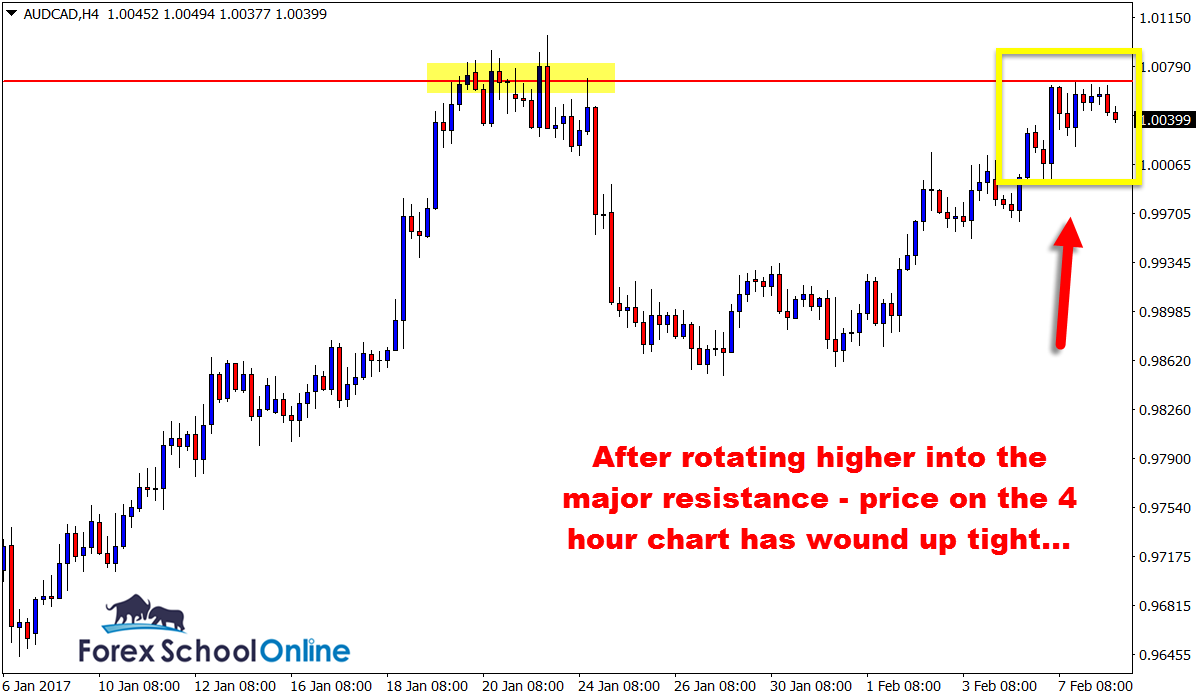
If we look at the intraday price action on the 4 hour chart and what the traders were doing on this time frame, we can see when price got to this level… once again there was rejection and indecision all over again.
Almost to the PIP we had sellers move in at this level and form Inside Bars = IB’s.
On the 4 hour chart below; I have the exact same resistance level marked as the daily time frame and I show you the inside bars.
This is going to be a very interesting market to watch and make potential trades in. If price does pullback lower, then there is a small amount of space to move into.
On the other hand for bullish traders looking for the break higher, if after a pullback lower price then makes another attempt that is successful at bursting out higher it could be large, aggressive and have a lot of momentum.
It could also pay to be on your toes and watching for potential entries as well.
Daily AUDCAD Chart

4 Hour AUDCAD Chart
Related Forex Trading Education


Leave a Reply