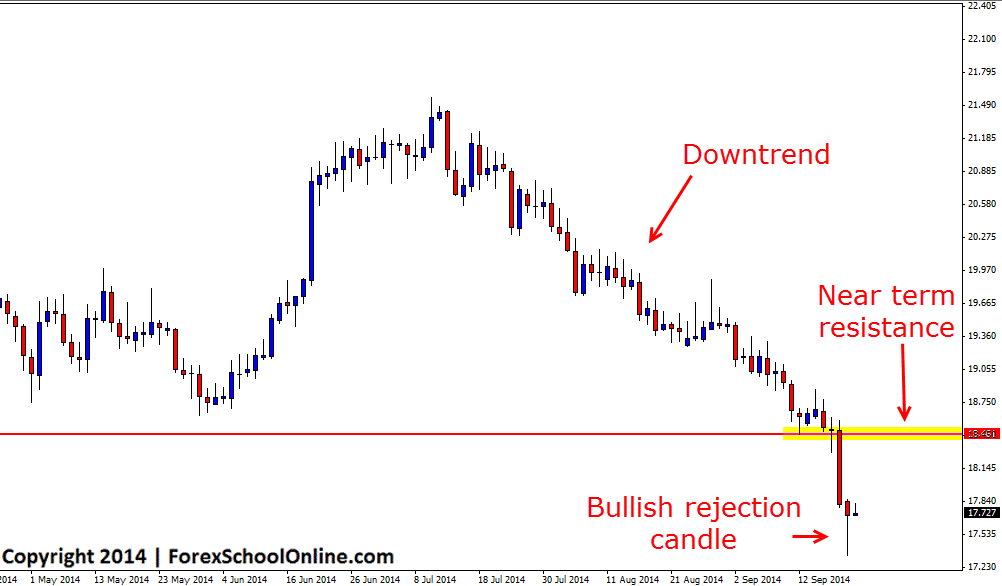
For the last six weeks price in the silver (Silver v USD) market has been in a strong downtrend as the daily charts show below. Price has sold off strongly lower with only the slightest of retraces back into value areas or resistance levels. Price has been making continued fresh lows, then stalling or what we often discuss as consolidating and then continuing, going on to new lows.
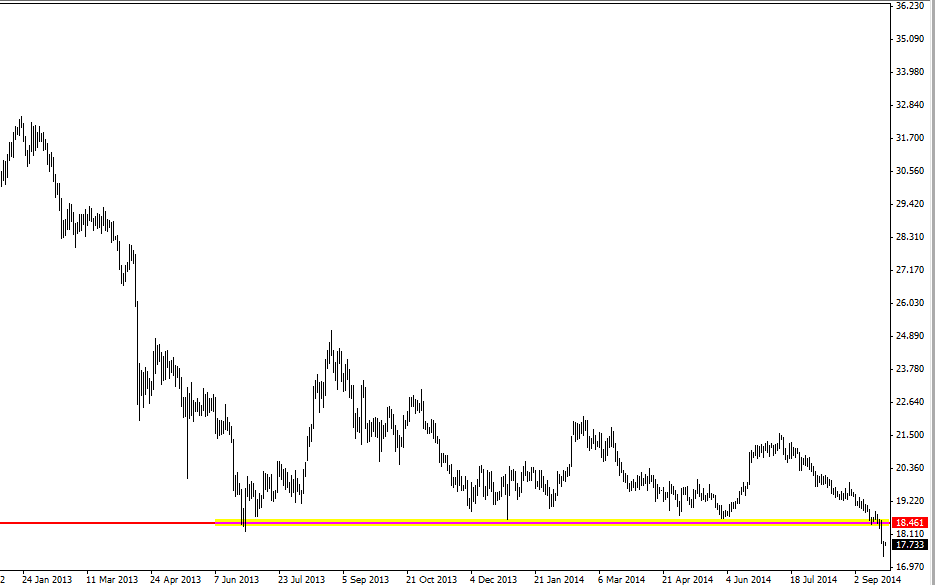
Price is now down to a level that is has not been down at since August 2010. These lows combined with the move of the last six weeks show how strong and savage this move lower has been of late. When a trend is as strong and clearly as obvious as what the Silver trend is currently, it normally pays to continue trading with it (and not try and fight it) until the price action gives strong clues that price has made a reversal to make a move the other way.
With this in mind, traders could look for potential short trades if price does retrace back higher and into the value area and near term resistance. As the daily price action chart shows below; the current daily candle is forming a bullish rejection candle/not quite pin bar that could hint at price moving back into the near term resistance that has also been a longer term resistance as shown on the zoomed out chart below.
Traders could look to take short setups on their daily or intraday charts. Traders would also need to see a high probability trigger signal to confirm any potential trade setup such as the ones taught in the Forex School Online Lifetime Membership.
Silver Daily Chart

Silver Daily Chart – Zoomed Out


Leave a Reply