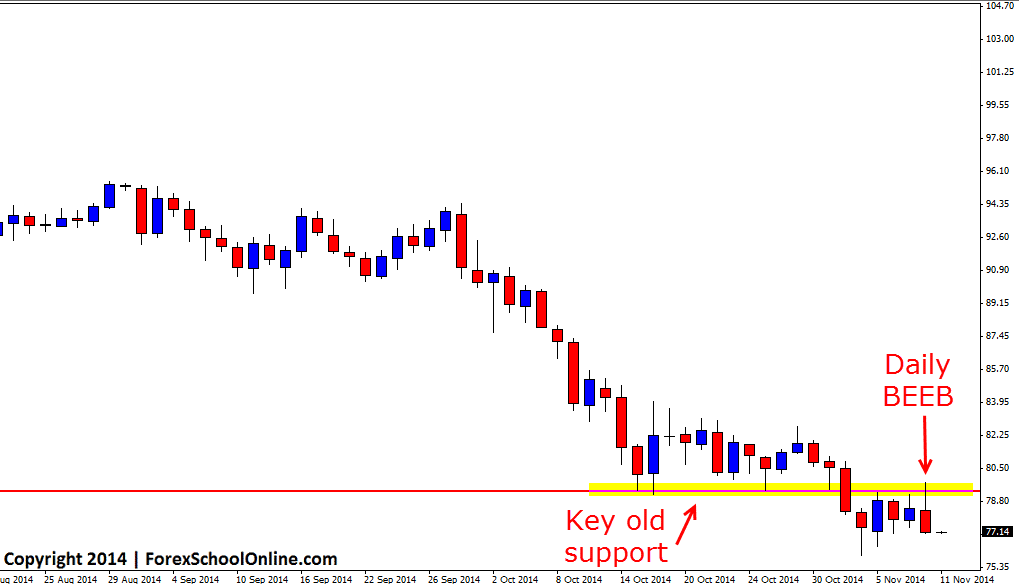
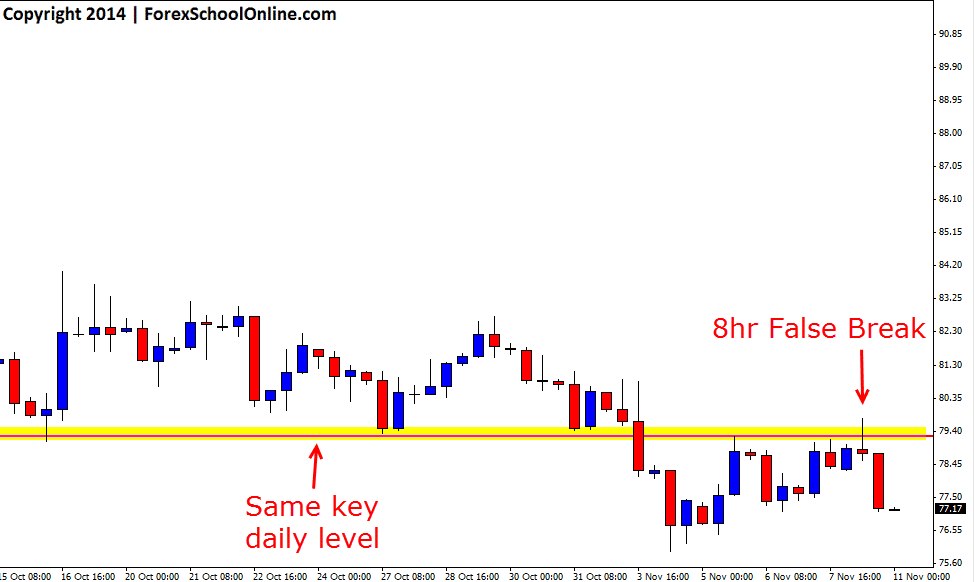
West Texas Intermediate vs USD (WTIvUSD) or Spot Oil Market has fired off a false break pin bar on the 8hr price action chart to make yet another move lower. This market has been smashed in recent times and is now in a very heavy down trend with price moving from a high of 107.64 to now be sitting around the 77.00 mark in just under five months of trading. The oil market is a very interesting market to watch because it has a wide ranging affect on many different markets and business right around the world. The oil price being pushed lower is obviously affecting a lot of different markets and businesses that rely on the oil price being higher for their profitability and with the price so low some businesses will not be able to continue running.
A huge mistake traders often make in these types of markets is looking at the price and thinking that because price has made such a large move lower it “just has to make a large reversal at some stage”, but the truth is markets are built on fear and greed and not on rationality as I go into depth in this trading lesson Supply & Demand – The Driver of Price. You will go broke before the market becomes rational and starts doing “what it should’. The best way to trade the market is by trading what is in front of you and not by what you think. In other words; follow the price action and not what you “think” should happen.
Price had been holding above a support level in this market and was pausing, but once this support gave way price quickly made another leg lower in the trend. This was then followed by a retrace back into the old support and new price flip resistance and it was here that price formed the 8hr false break pin bar reversal. This false break pin bar was sticking up at the high and through the price flip resistance and making a clear false break of the key level. After breaking below and confirming the pin bar reversal, price has once again continued with the trend lower. On the daily chart price has now formed a Bearish Engulfing Bar (BEEB).
This daily BEEB could send price lower and into the recent daily swing support area. If this recent swing low support area does break and give way, then the trend lower could look to continue and more moves lower could be on the cards for this market.
NOTE: If you want to make an 8hr time frame like the chart below or make any other time frames you wish with your MT4 charts, then read this lesson here; Change MT4 Time Frame Indicator EA
Oil Daily Chart

Oil 8 Hour Chart


Good work!
Hello,
am I right in saying, that this was a nice PB to read the Price Action but not a nice one to trade, as it is not really large and obvious like you often mentioned it has to be?
Best regards
Hello Viktor,
whether or not it is tradeable is up to the individual trader and their personal rule set, but what you need to keep in mind is that the size of a setup can be different depending on the price action story. In other words; we don’t just always need a set size for a pin bar or an engulfing bar or any other trigger signal.
The price action story is what is important and what is telling us what is going on with the order flow and the traders behavior behind the charts in the market. For example; If price was in a strong down-trend and price was rejecting a solid support level, we would need to see a far larger reversal signal to make us consider taking a long trade than if price was trading with a strong trend and was at a major price flip level. If price was at a major price flip level, trading with a strong trend, making a false break and had space to move into, we are going to be a lot more likely to take a smaller trigger signal than that of the against the trend example because of the price action story.
We cannot just say we need a huge trigger signal and be done with it. This is what pattern trader do. As price action traders we are looking at the whole price action story.
Safe trading,
Johnathon