Weekly Price Action Trade Ideas – October 22nd
Markets Discussed Today: EURUSD, USDCAD, EURCAD & GOLD v USD
EURUSD 4 Hour Chart
Clearly Defined Intraday Range
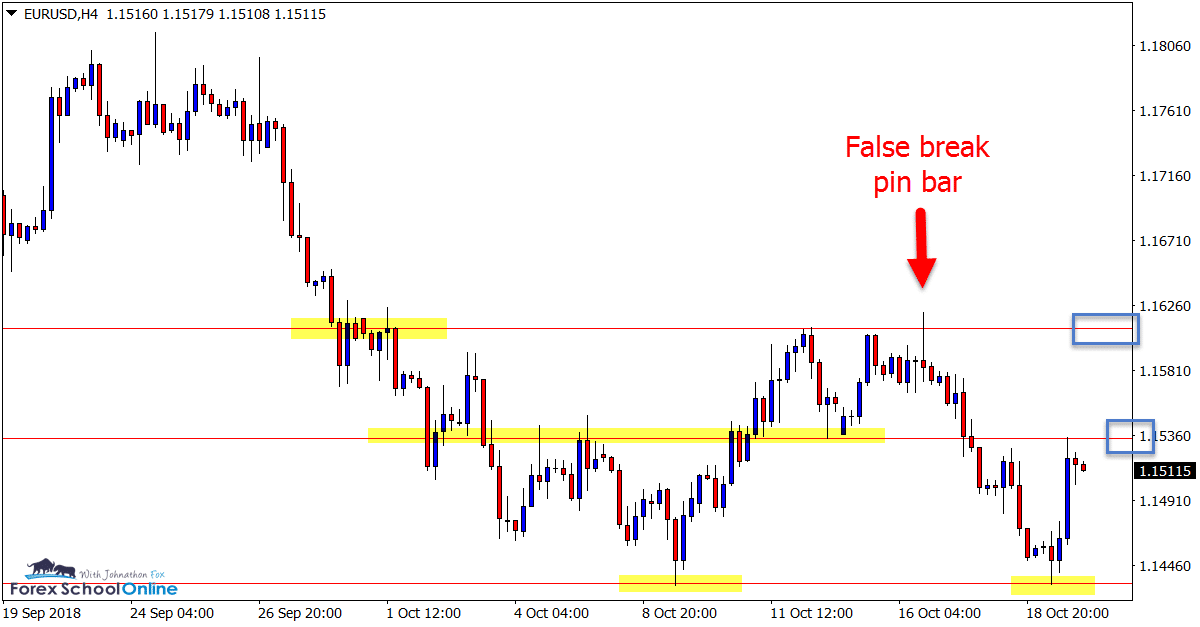
Price on the EURUSD has bounced off the recent support level and formed a daily Bullish Engulfing Bar = BUEB.
As the 4 hour chart shows below; price on the intraday chart is in a fairly clear sideways range with a defined high and low.
Often these types of ranges will have a midway point. We can see price is now testing this ranges midway point and attempting to try to break higher.
If price can break higher we could see another attempt to breakout of the overhead resistance where price last formed a false break pin bar reversal.
4 Hour Chart

USDCAD Daily Chart
Can Price Hold Breakout?
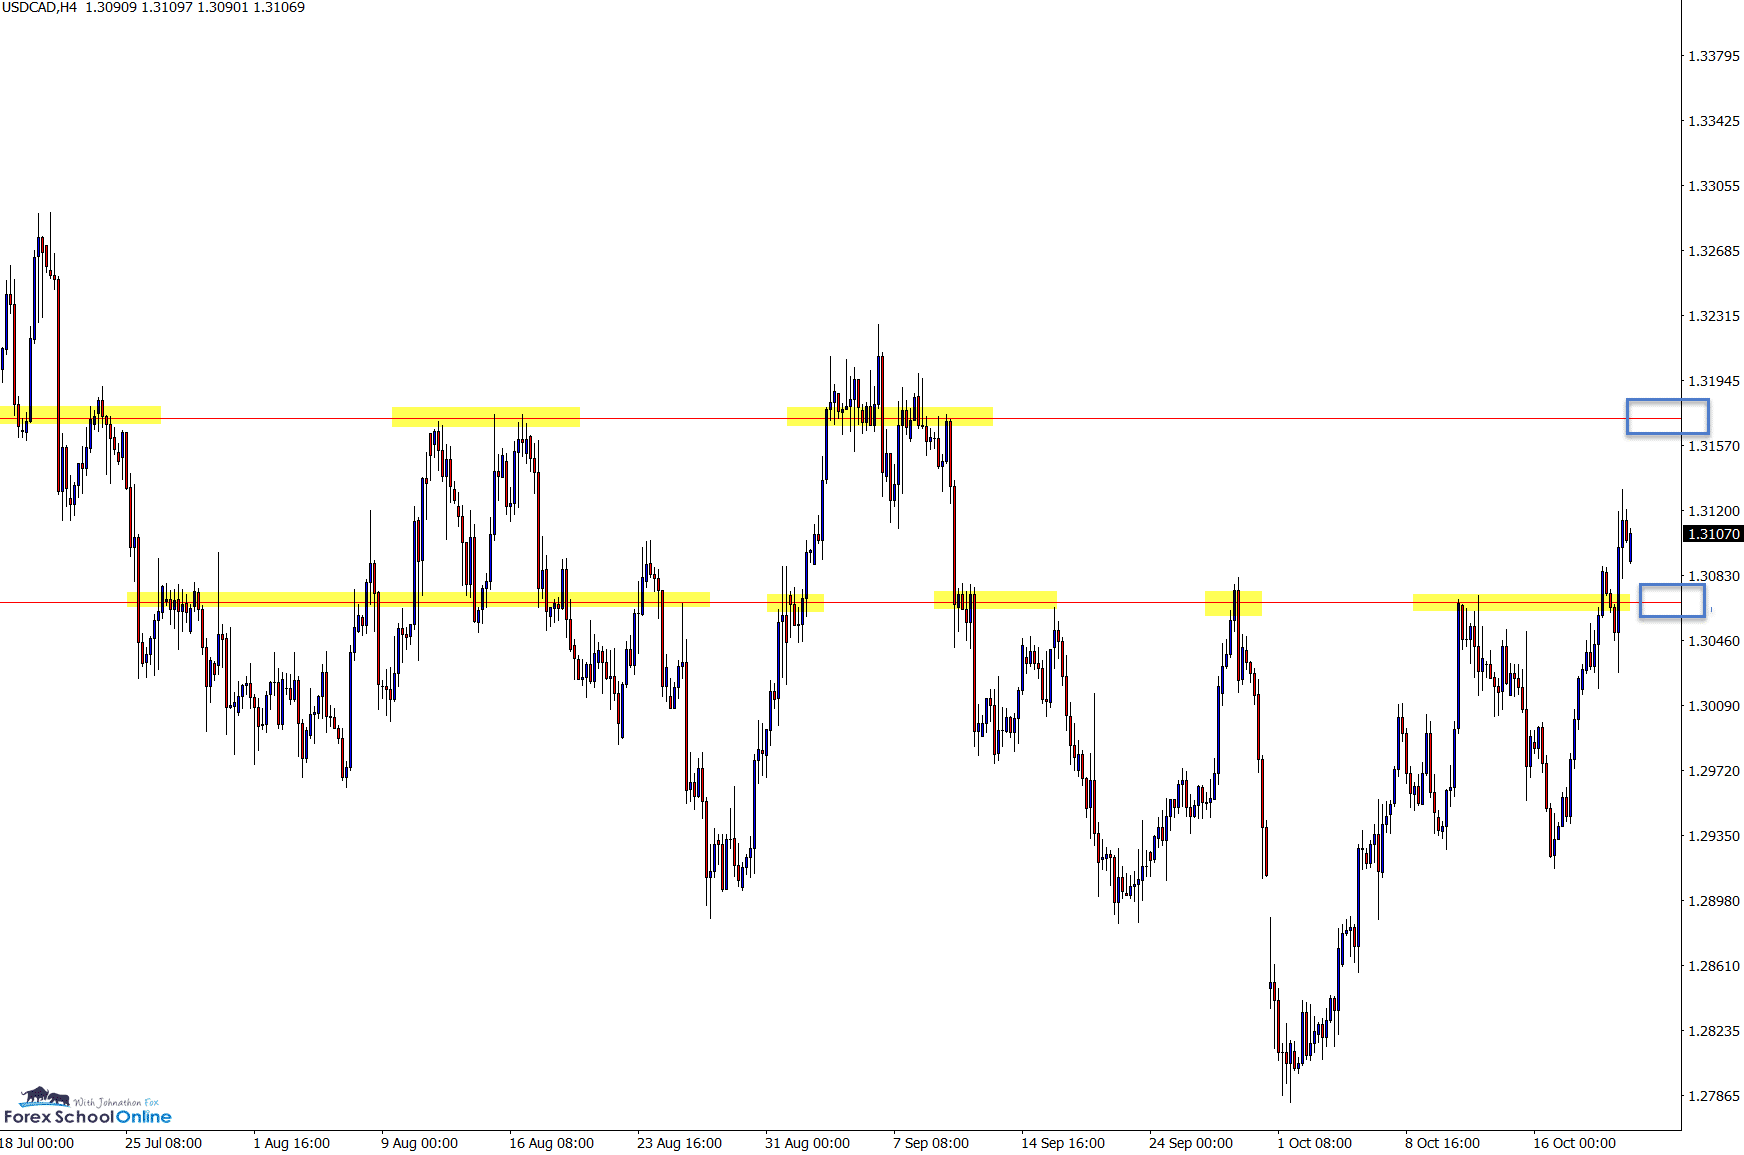
Price bounded out of the major resistance level on the USDCAD daily and 4 hour chart with a strong 4 hour Bullish Engulfing Bar = BUEB.
Whilst this market is a little on the choppy side, there could now be room to move higher if this old resistance and new support can hold as a price flip over the coming sessions.
This level could be crucial to whether price continues on with this breakout and into the major level overhead.
Daily Chart

4 Hour Chart

EURCAD Daily Chart
Engulfing Bars at High and Low of Range
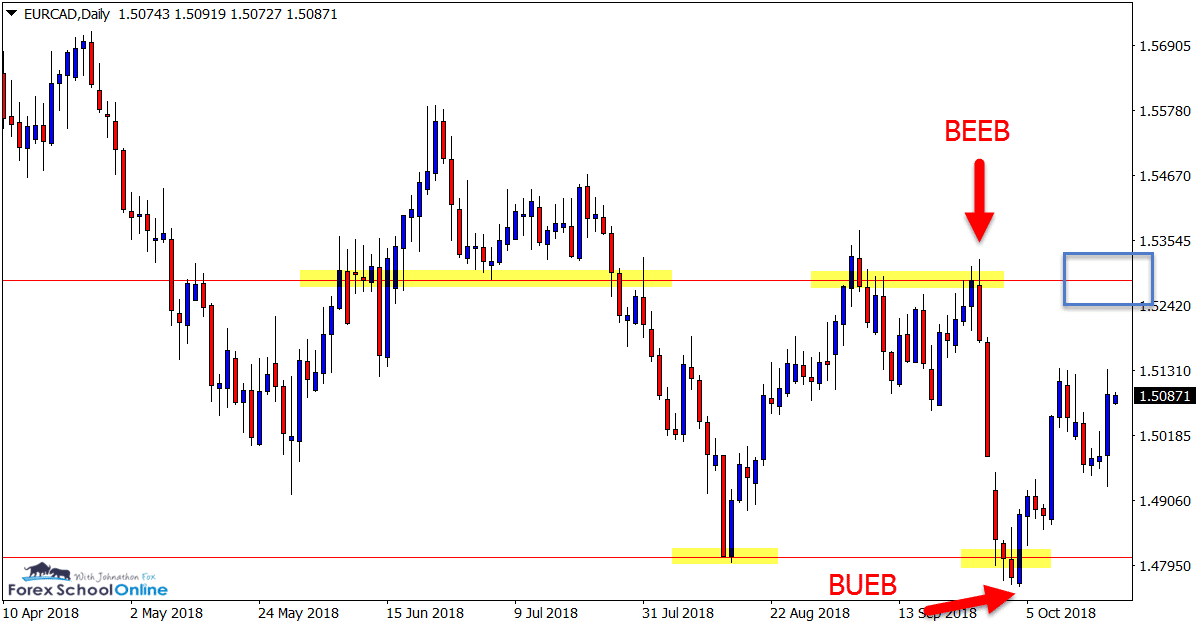
The EURCAD daily price action chart recently slammed lower off the major daily resistance level after firing off a Bearish Engulfing Bar = BEEB.
Price quickly picked up momentum and was only halted when running into the near support level and forming a BUEB. Price has now rebounded from this engulfing bar to be bouncing around the midpoint of the daily range area.
If price can make another push higher we could see a solid test of the resistance with potential short trade setups.
Daily Chart

GOLD V USD Daily Chart
Price Breaks Out of Base Low
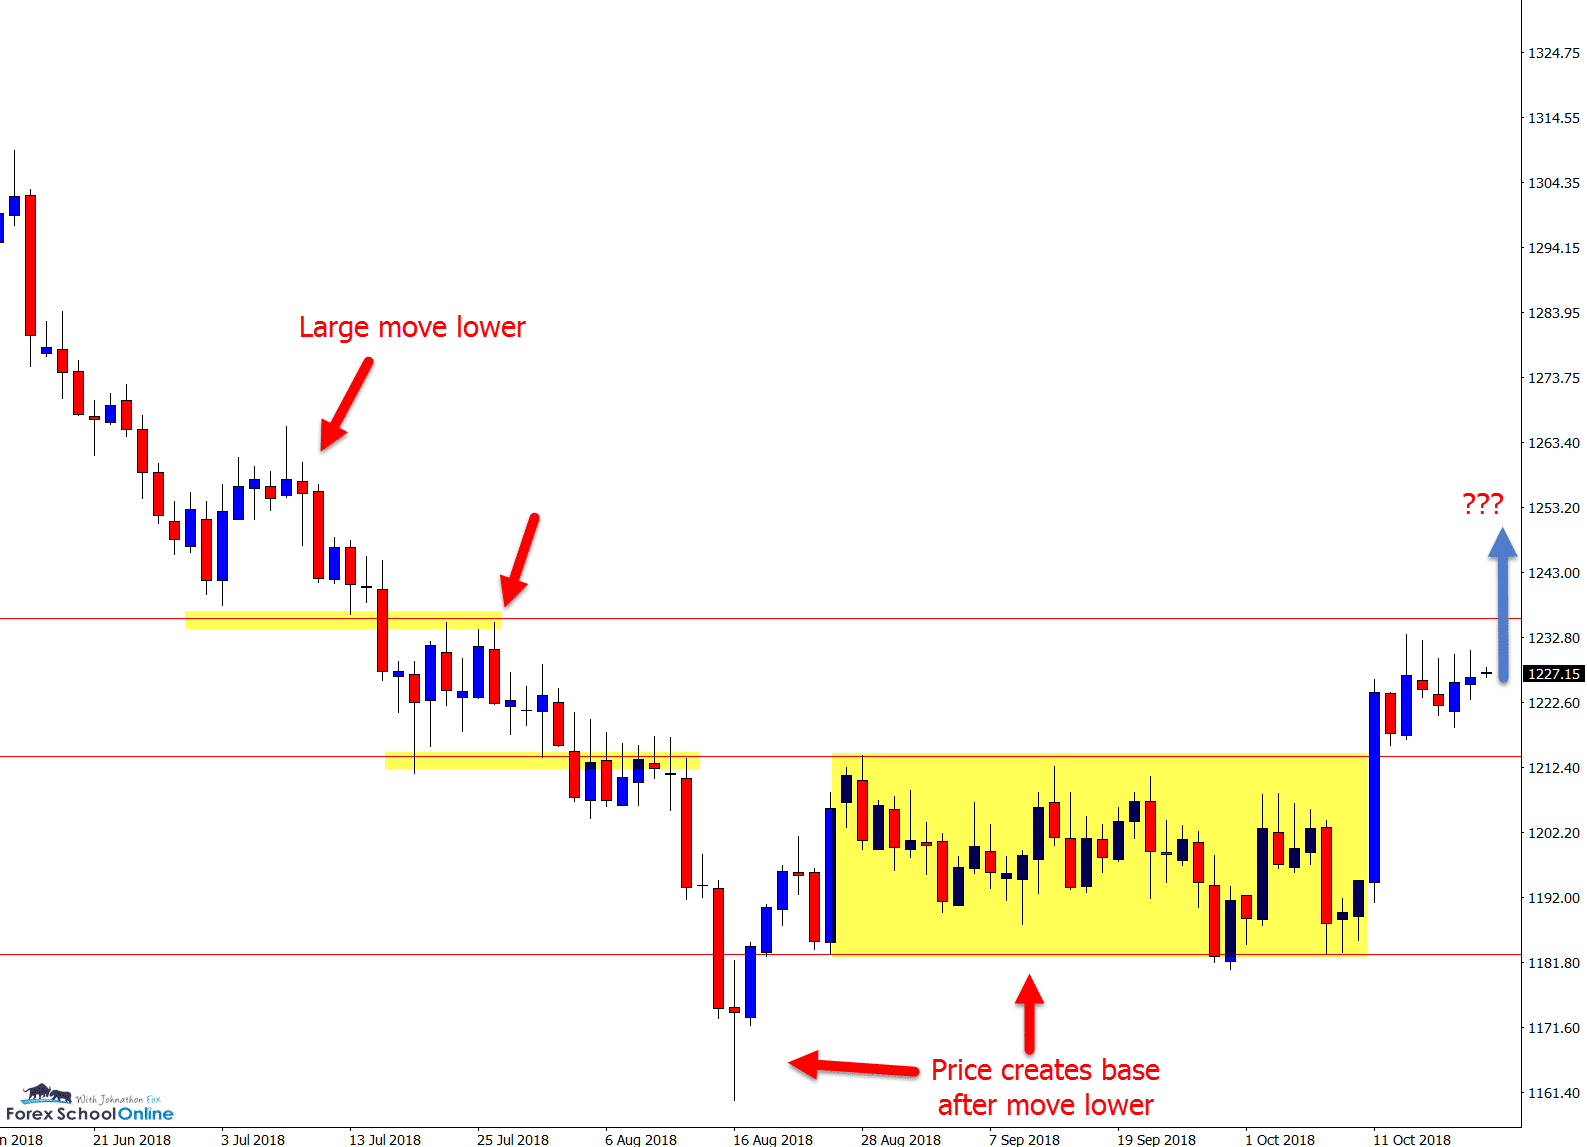
After discussing the Gold price action recently in the ‘Charts in Focus’ Here looking at how price had formed a lower base for a potential reversal higher, we can see price has now finally broken higher.
After a large and sustained move lower, we can see price formed a lower base that first started with a rejection of lower prices.
Price has since consolidated and broken through the consolidation to move higher.
Price is now winding up and stalling. If it can hold and, then break higher, it could signal a potential strong move to the upside.
Daily Chart

Note: We Use Correct ‘New York Close 5 Day Charts’ – Download Free New York Close Demo Charts Here
Charts in Focus Note: All views, discussions and posts in the ‘charts in focus’ are the view of Forex School Online and are not recommendations or trading advice. All posts are general in nature and are not advice to buy or sell.
Please leave questions or comments in the comments section below;


thanx Coach .
I just want to know what to do if Take Profit missed with few pips, perhaps the bar missing TP is pin bar at key level. Should I start locking the profits?
Hi i wnt to get daily trades set up daily i enjoy ur analysis.
HI Gijimani,
nice to have you with us.
At this stage in the public section we have weekly charts in focus and regular lessons.
Safe trading,
Johnathon