Weekly Price Action Trade Ideas – 9th to 13th September 2019
Markets Discussed in This Week’s Trade Ideas: EURUSD, USDJPY, SILVER and US30.
USDJPY Daily and 4 Hour Charts
Price Breaks Out With Inside Bar
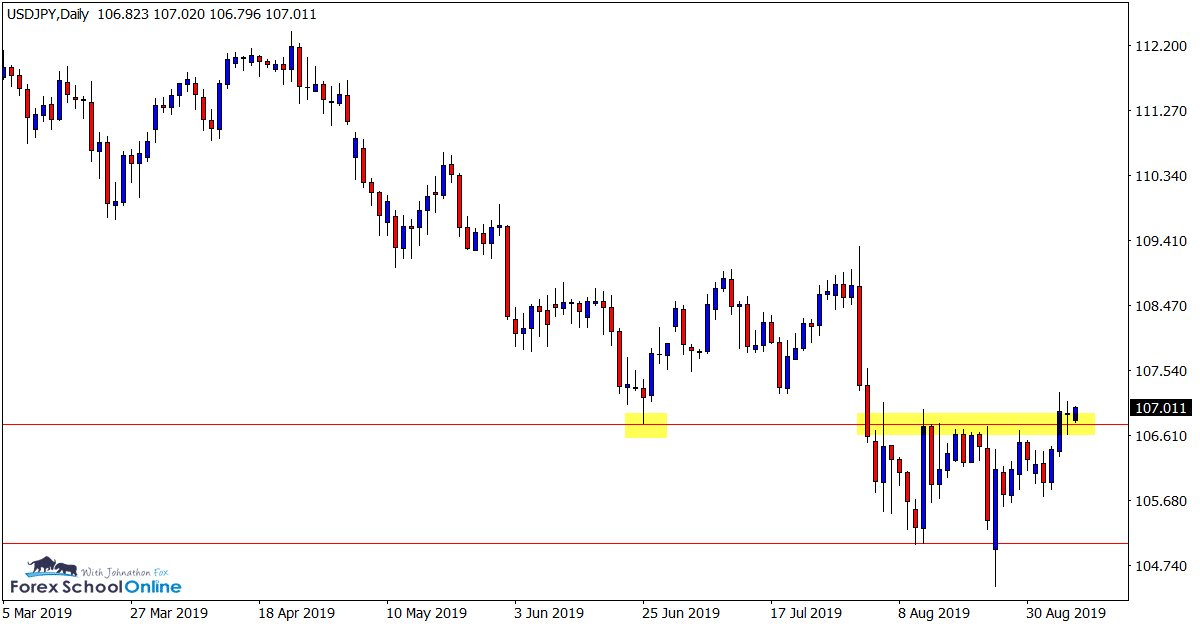
In last week’s price action trade ideas we were watching the USDJPY and the tight box price was ranging within.
Price had in recent times been consolidating and trading within a fairly tight box with clear highs and lows.
At the end of last week price attempted to breakout higher through this range and as the daily chart shows below; we now have a close above the resistance and an inside bar sitting on the support level.
The next few sessions look to be crucial. If the old resistance can hold as a new support it could help push price for the next leg higher.
Daily Chart
4 Hour Chart

EURUSD Daily and 12 Hour Charts
Daily and 12 Hour Pin Bars
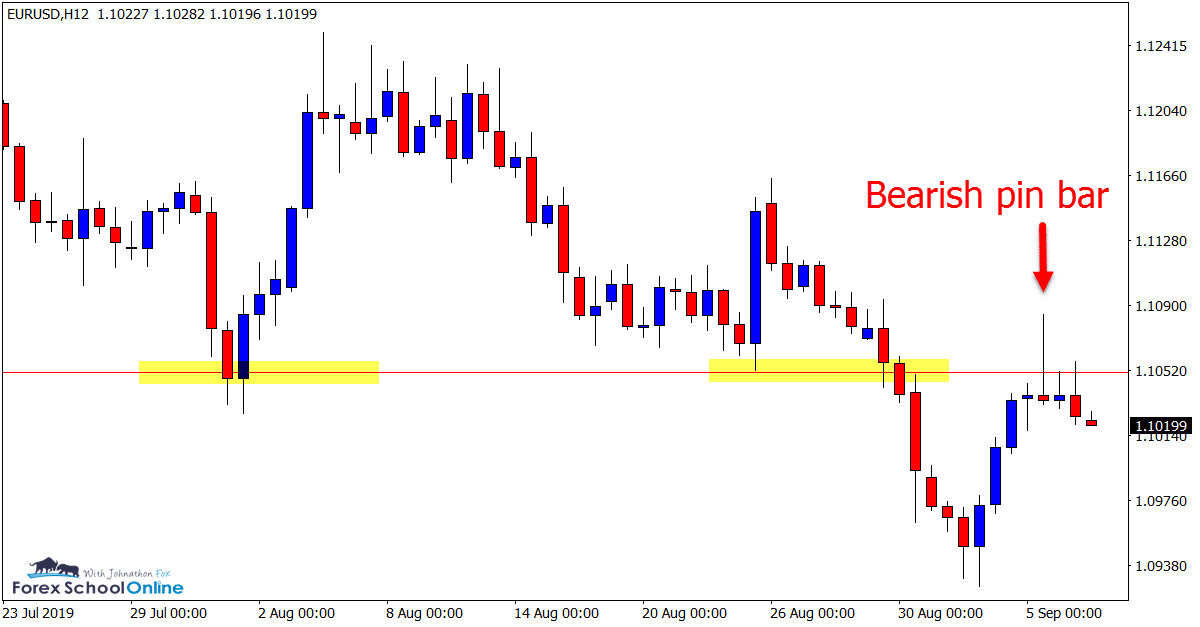
This was another market we discussed last week, watching the old support level to see if it would flip and hold as a potential resistance.
As both the daily and 12 hour charts show below; price has rotated back higher and into this level and fired off bearish pin bar reversals.
If price is to gain momentum and sell off from this level we will need to see the daily pin bar lows aggressively taken out.
NOTE: If you want to create 12 hour charts (or any time frame) on your MT4 charts, get the free indicator at; Create Any Time Frames on MT4
Daily Chart

12 Hour Chart
SILVER Weekly Chart
Huge Pin Bar
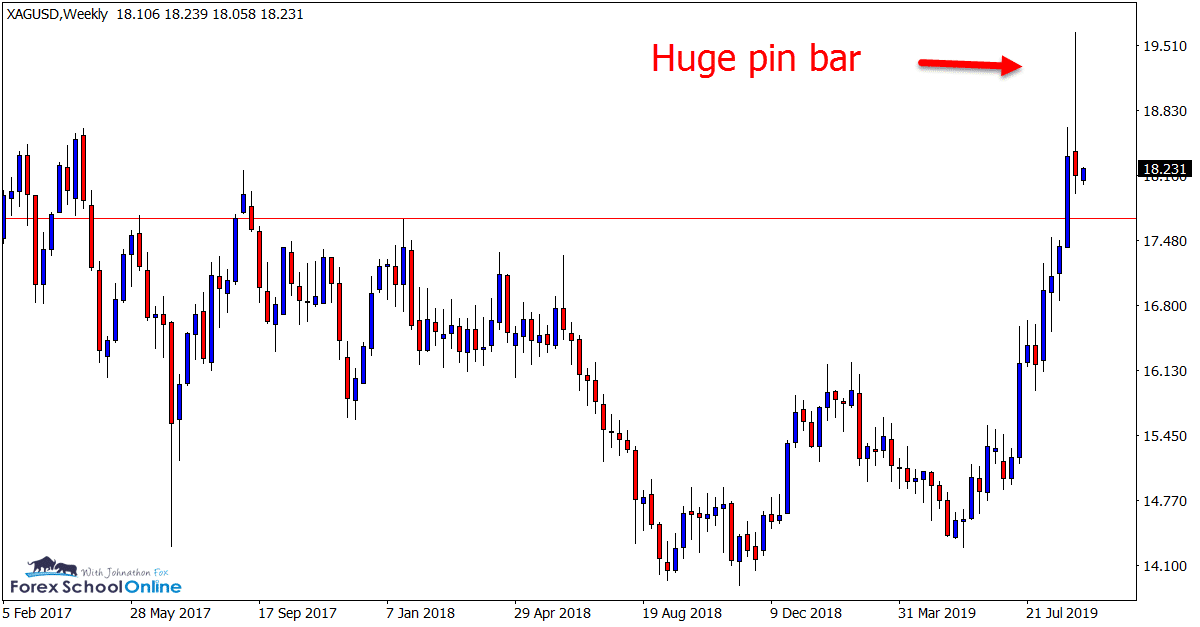
Both this and the Gold markets have been roaring higher in solid up-trends of late.
The Silver market in particular has seen price rise sharply in recent months without many chances to climb aboard the move.
Whilst we don’t often post weekly charts, the weekly time frame chart below highlights both the large pin bar and the potential near term support for this market.
This is a large counter-trend pin bar and the near term support will be a very interesting watch over the coming sessions.
Weekly Chart
US30 Daily and 1 Hour Charts
Breakout and Pin Bar on 1 Hour Chart
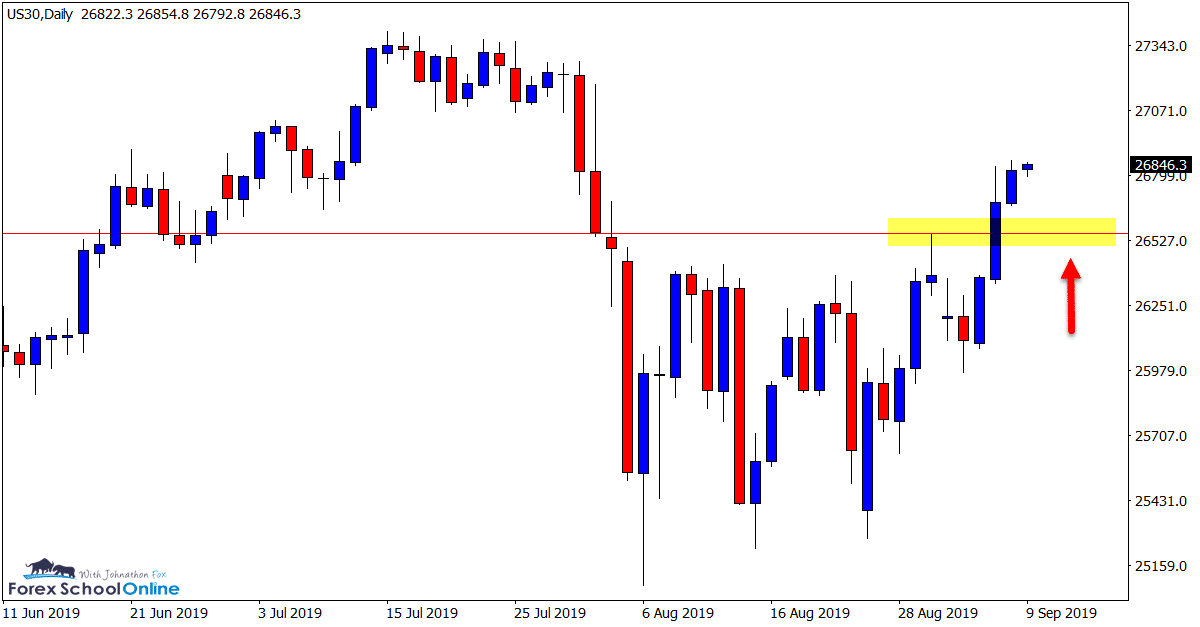
This is a market we have been charting quite a bit in recent times because of it’s clear levels and large moves.
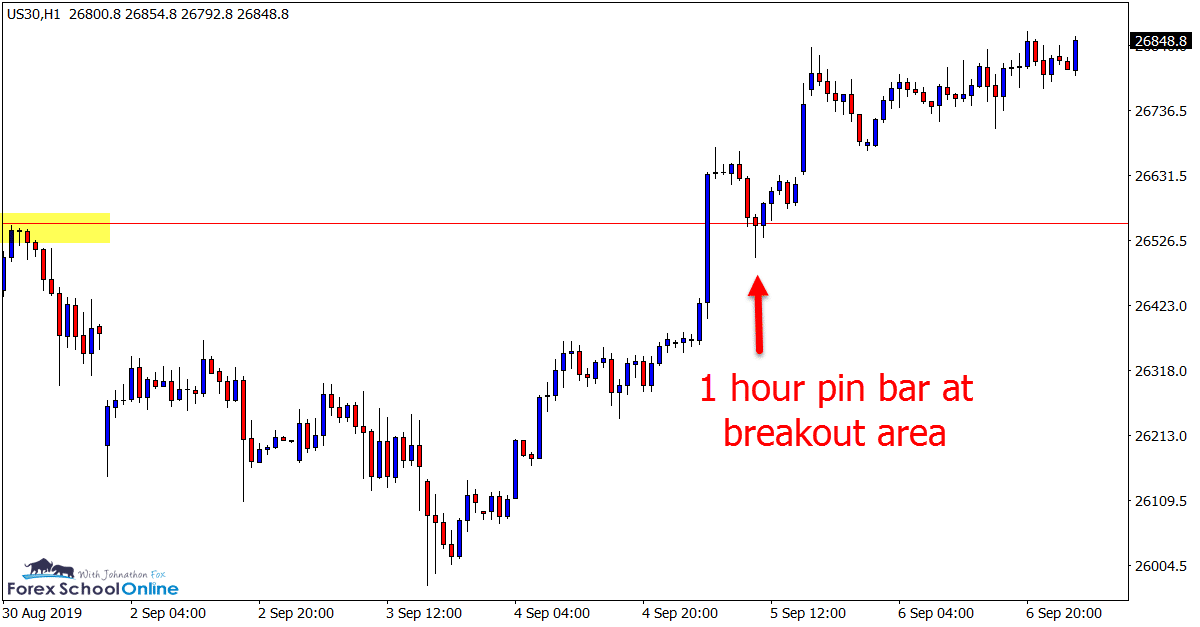
Whilst price had been stuck trading between the range high and low, during the past week we have seen price breakout quickly.
When price breaks out of a range such as this that has been tested on multiple occasions two things will often happen. 1: The breakout will be fast and aggressive and 2: Price will often make either a quick pause or retrace into the highest / lowest point of the breakout area before continuing.
I go into this in more depth in the lesson; How to Find Intraday Breakout Trades
As the 1 hour chart shows below; after making the breakout price quickly paused, rotated into the breakout area, formed a pin bar and then continued. On the 4 hour chart this looks like a quick pause with an inside bar.
Daily Chart
1 Hour Chart
Note: We Use Correct ‘New York Close 5 Day Charts’ – You can read about why we use these and how to download the correct free charts at Correct Free New York Close Demo Charts
Trade Ideas Note: All views, discussions and posts in the ‘charts in focus’ are the view of Forex School Online and are not recommendations or trading advice. All posts are general in nature and are not advice to buy or sell.
Please leave questions or comments in the comments section below;


Leave a Reply