Weekly Price Action Trade Ideas – 9th to 13th Nov 2020
Markets Discussed in This Week’s Trade Ideas: AUDJPY, USDJPY, USDSGD and GER30.
Note: We Use Correct ‘New York Close 5 Day Charts’ – You can read about why we use these and how to download the correct free charts at Correct Free New York Close Demo Charts
AUDJPY Daily Chart
-
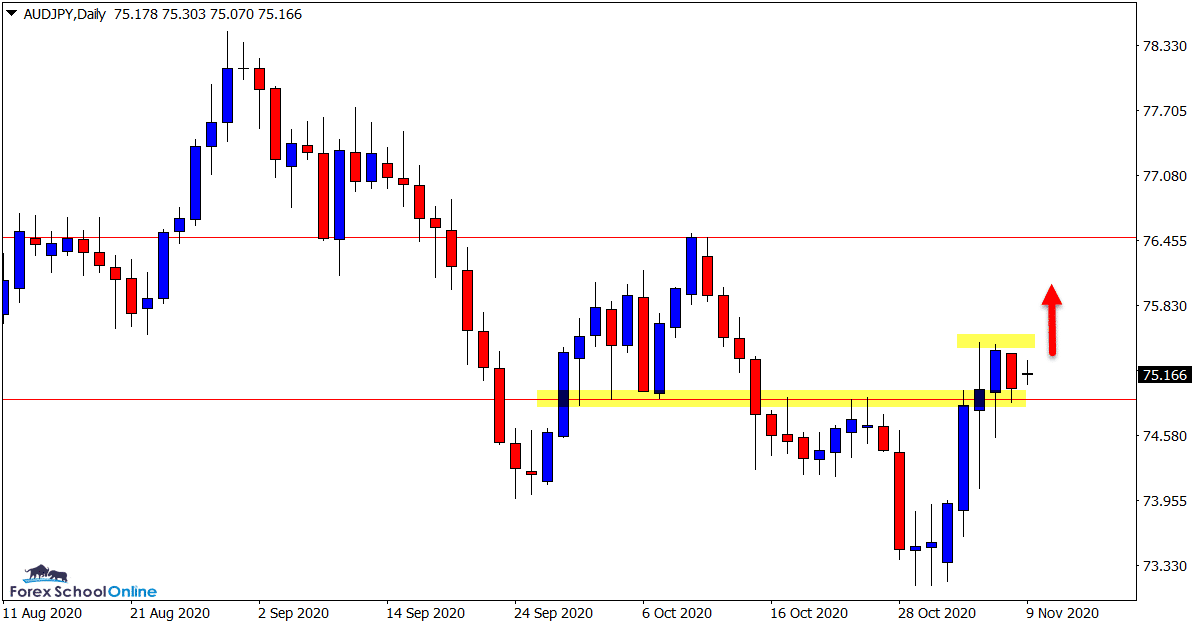
Double Inside Bar Formed at Daily Support
Price action on this pair has now formed a double inside bar pattern on the daily chart.
This is a pretty rare pattern because whilst we will often get a series of candles that are formed inside one large candle, they are not often consecutive inside bars.
This pattern is sitting directly on the recent resistance level and new price flip support level.
If we can see this level hold, we could see the pattern break to the upside to activate potential long trades for a run into the overhead resistance.
Daily Chart

USDJPY Daily Chart
-
Watching for Pullback to Short
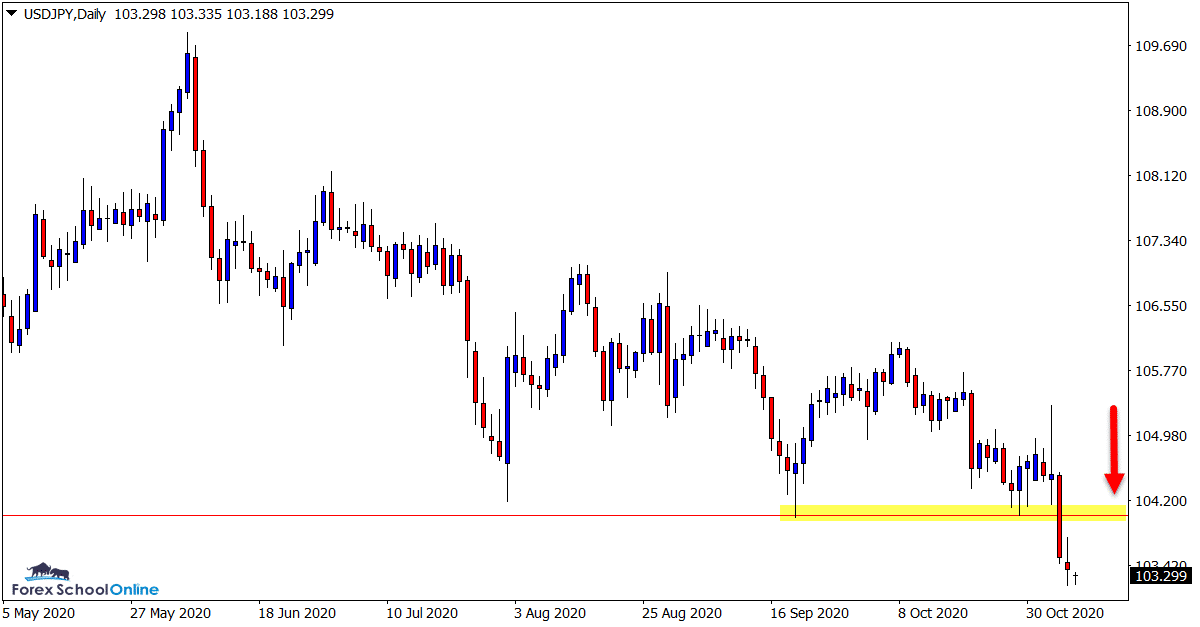
Price in this pair has now formed a series of lower highs and also broken through an important daily chart support level.
The best play in this pair looks to be watching for any sharp retracements higher and looking to short with the new momentum lower.
As the daily chart shows, the support level that price has just broken out of looks a key level.
If price can move back to somewhere near that level it could hold as a new price flip resistance and an area to hunt for short trades.
Daily Chart

USDSGD Daily Chart
-
Will Price Make Retracement Higher?
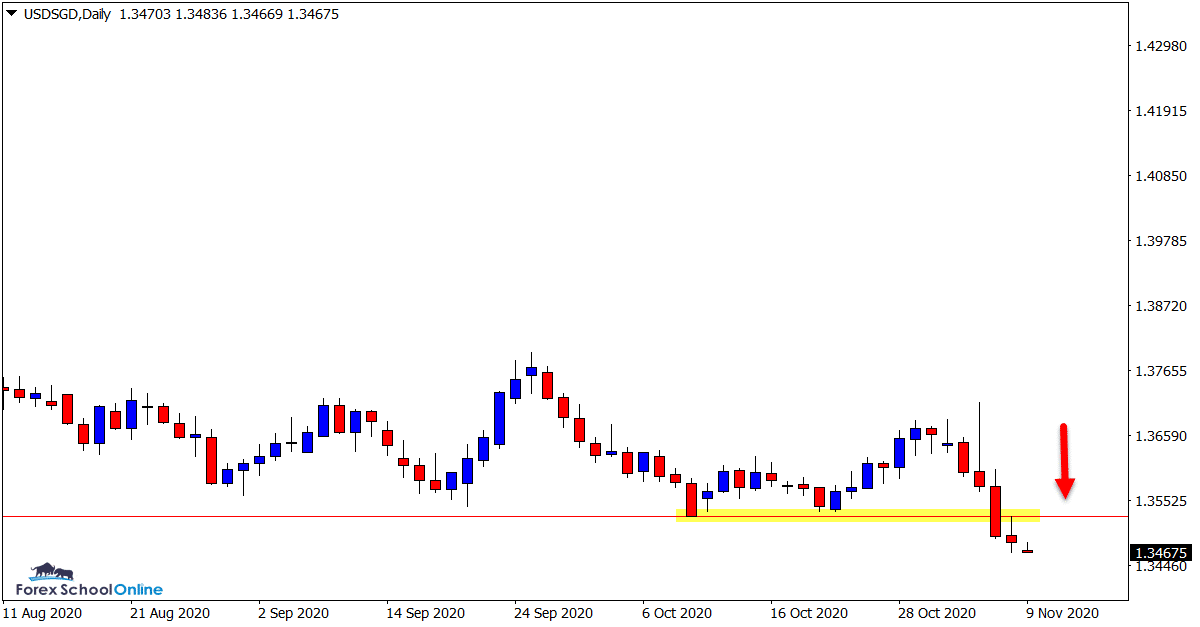
In a very similar fashion to the USDJPY, this pair at the end of last week also sold off heavily and made a decent move lower.
Just like the USDJPY did also, this pair broke through a recent strong daily chart support level.
If we can see price make a rotation back higher into a value area, then we could look to make short trades.
Short trades would be inline with the recent strong momentum lower and at a key price flip level on the daily chart.
Daily Chart

GER30 Daily Chart
-
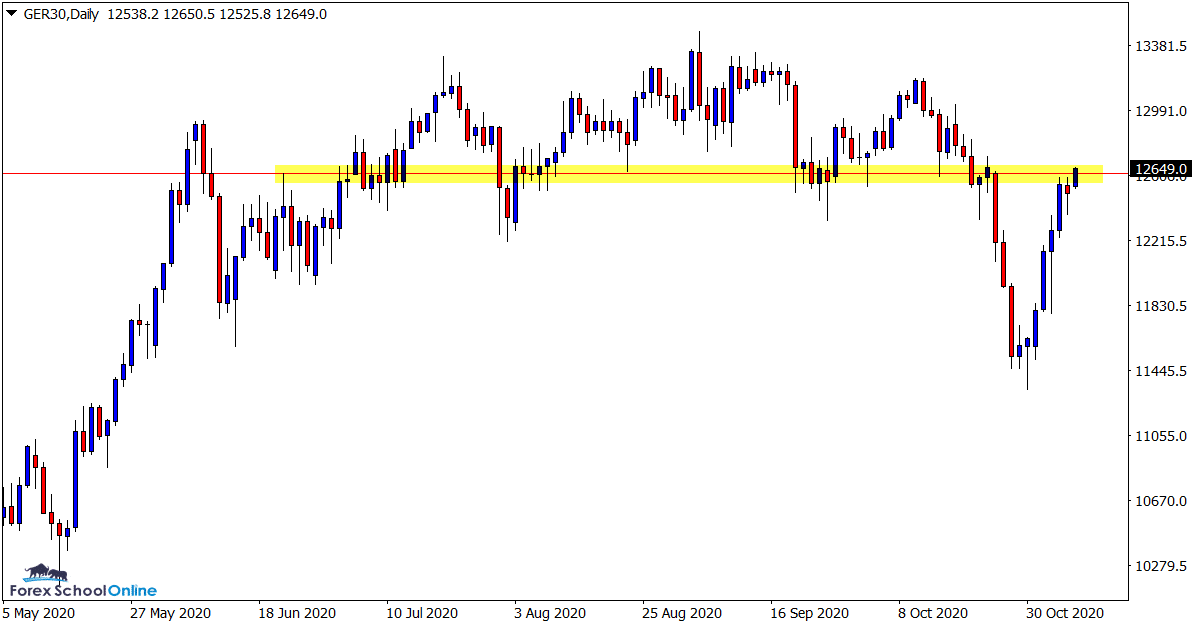
Important Daily Resistance Now Being Tested
This market faces an important test this week.
Before the last seven or eight sessions, price had been selling off strongly and looking to make a new trend lower.
That has now changed quickly with price right back at the old breakout level and strong resistance zone.
As the daily chart shows; this resistance zone has been a major level this year as both a proven support and resistance level.
The best play in this market at this level looks to be watching the price action clues to see if price wants to reject this level or continue on with the recent strong momentum higher.
Daily Chart

Trade Ideas Note: All views, discussions and posts in the ‘charts in focus trade ideas’ are the view of Forex School Online and are not recommendations or trading advice. All posts are general in nature and are not advice to buy or sell.
Note: We Use Correct ‘New York Close 5 Day Charts’ – You can read about why we use these and how to download the correct free charts at Correct Free New York Close Demo Charts
Please leave questions or comments in the comments section below;


Leave a Reply