Weekly Price Action Trade Ideas – 9th to 13th March 2020
Markets Discussed in This Week’s Trade Ideas: EURGBP, EURJPY, NZDJPY and OIL.
Note: We Use Correct ‘New York Close 5 Day Charts’ – You can read about why we use these and how to download the correct free charts at Correct Free New York Close Demo Charts
EURGBP Daily Chart
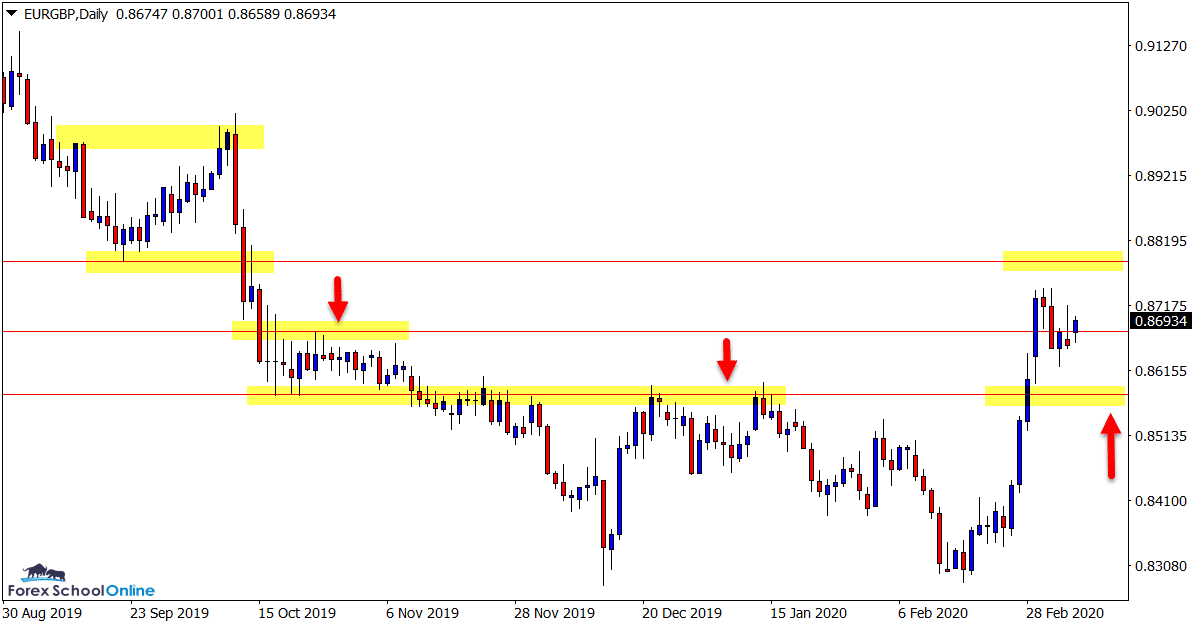
Indecision After Break Higher
After breaking out higher and making a nice move, we have not seen the follow through that we may have expected.
Whilst price did make a solid move, it has since stalled and not made the fast breakout that many other EUR pairs saw.
Price is now stuck between a couple of important levels as the daily chart shows below.
If we get a pullback into the old resistance it could be a solid level to watch for it to act as new support and for potential long trades.
Daily Chart
NZDJPY Daily and 4 Hour Charts
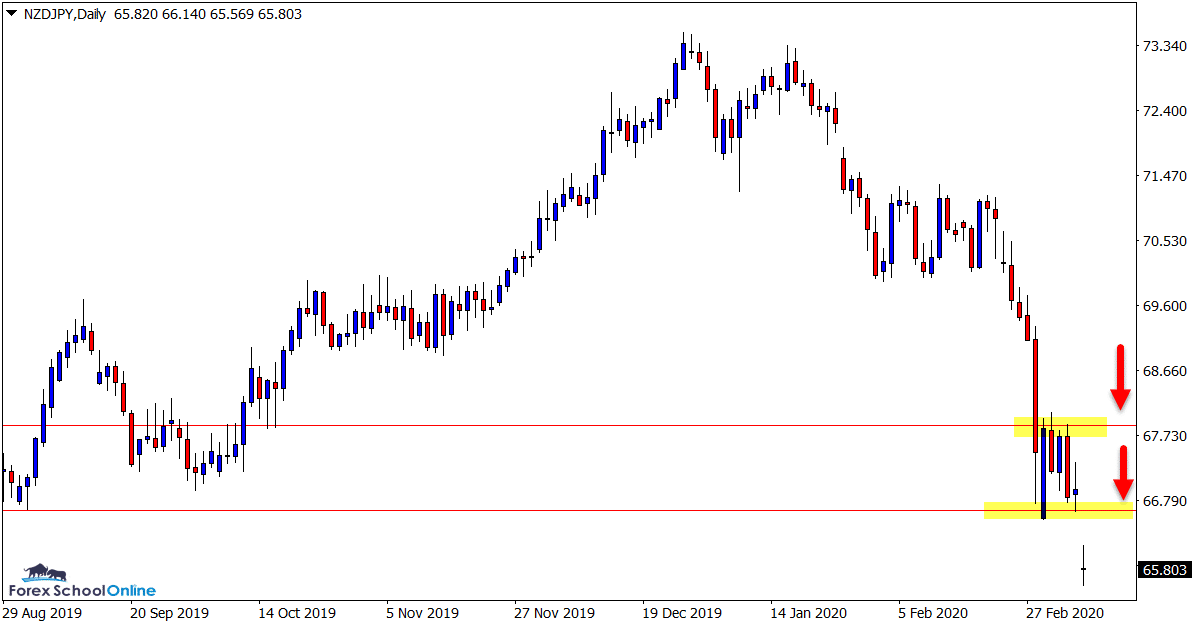
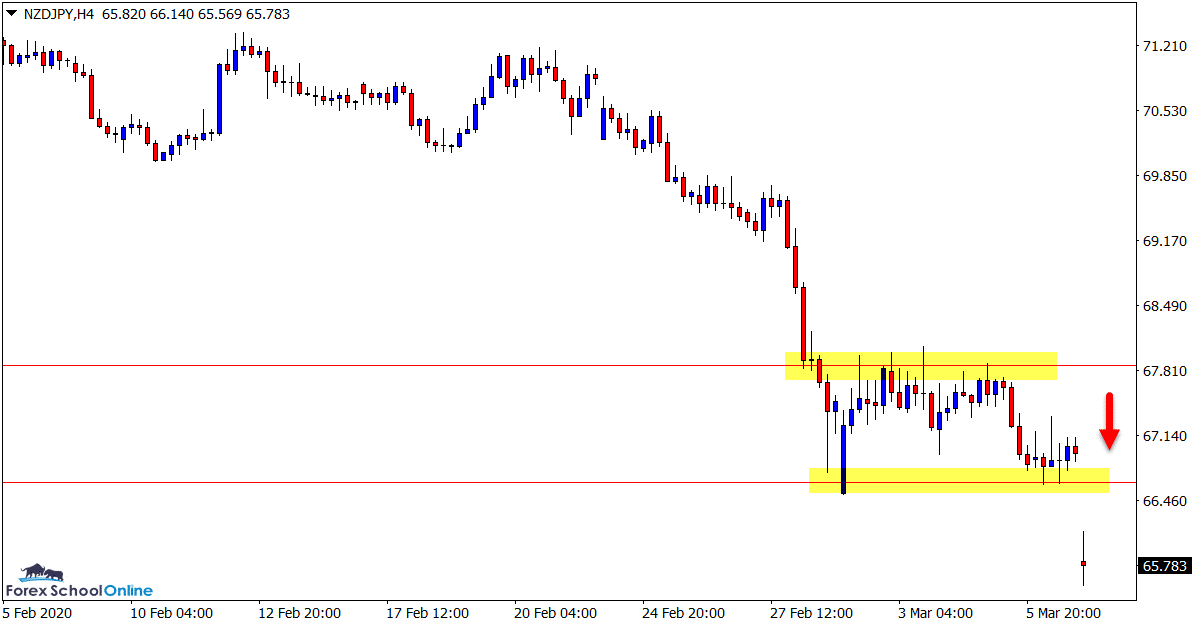
Watching for Potential Short Trades
The NZDJPY is a pair we have been charting and watching closely for a long period now.
Back in the 25th Feb trade ideas we were looking for the consolidation range to break and for potential breakout trades.
As is often the case, once price broke out of the tight consolidation box area it did so fast and aggressively.
It has since sold off and the pattern we were looking for in last week’s trade ideas could now play out again.
Daily Chart
4 Hour Chart
OIL v USD Daily Charts
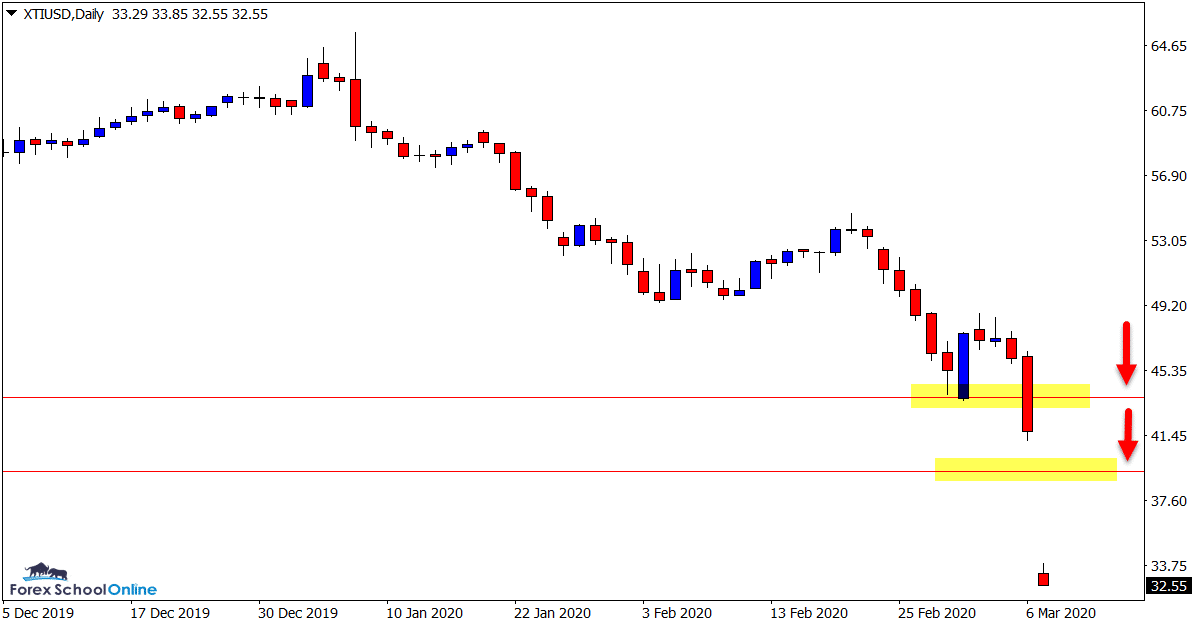
Huge Sell Off Playing out
Oil has seen a huge sell off in recent sessions with price getting absolutely smashed lower.
Until the momentum changes the best play could be to look to trade inline with the strong move lower and watch for quick retracements back into resistance.
Overhead resistance levels come in around the 36.15 and 39.00 areas and could be solid areas to watch for bearish price action.
Daily Chart
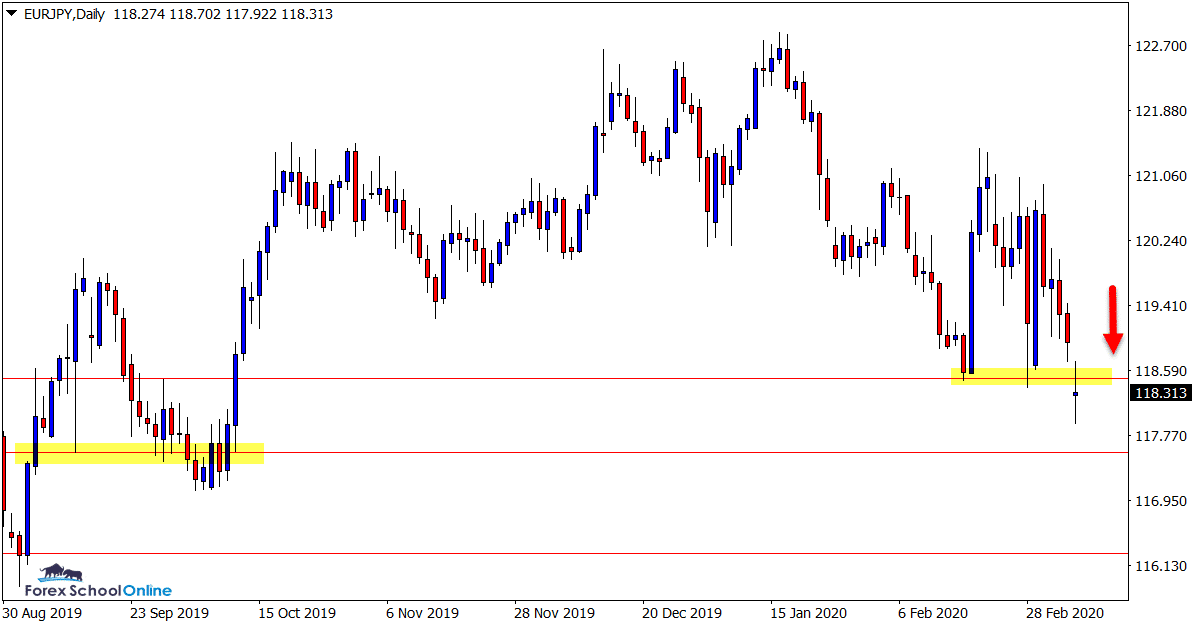
EURJPY Daily Chart
Will Price Break or Fake?
Interesting chart this one.
Whilst many markets and Forex pairs are making huge moves, this pair is still stuck treading water.
This could change in the coming sessions as price is now testing a pretty important support level.
If we can see a clear break below this level it could open the door for fast moves lower and another market selling off.
It could also pave the way for potential breakout trades.
Daily Chart
Trade Ideas Note: All views, discussions and posts in the ‘charts in focus trade ideas’ are the view of Forex School Online and are not recommendations or trading advice. All posts are general in nature and are not advice to buy or sell.
Note: We Use Correct ‘New York Close 5 Day Charts’ – You can read about why we use these and how to download the correct free charts at Correct Free New York Close Demo Charts
Please leave questions or comments in the comments section below;


Your post been very helpful. How do I get the new York close 5 days chart on my android device? Tha
You can download the MT4 app and use the same NY close broker feed when setting up your account.