Weekly Price Action Trade Ideas – 8th Jan 2019
Markets Discussed Today: AUDUSD, EURUSD, GOLD & BITCOIN
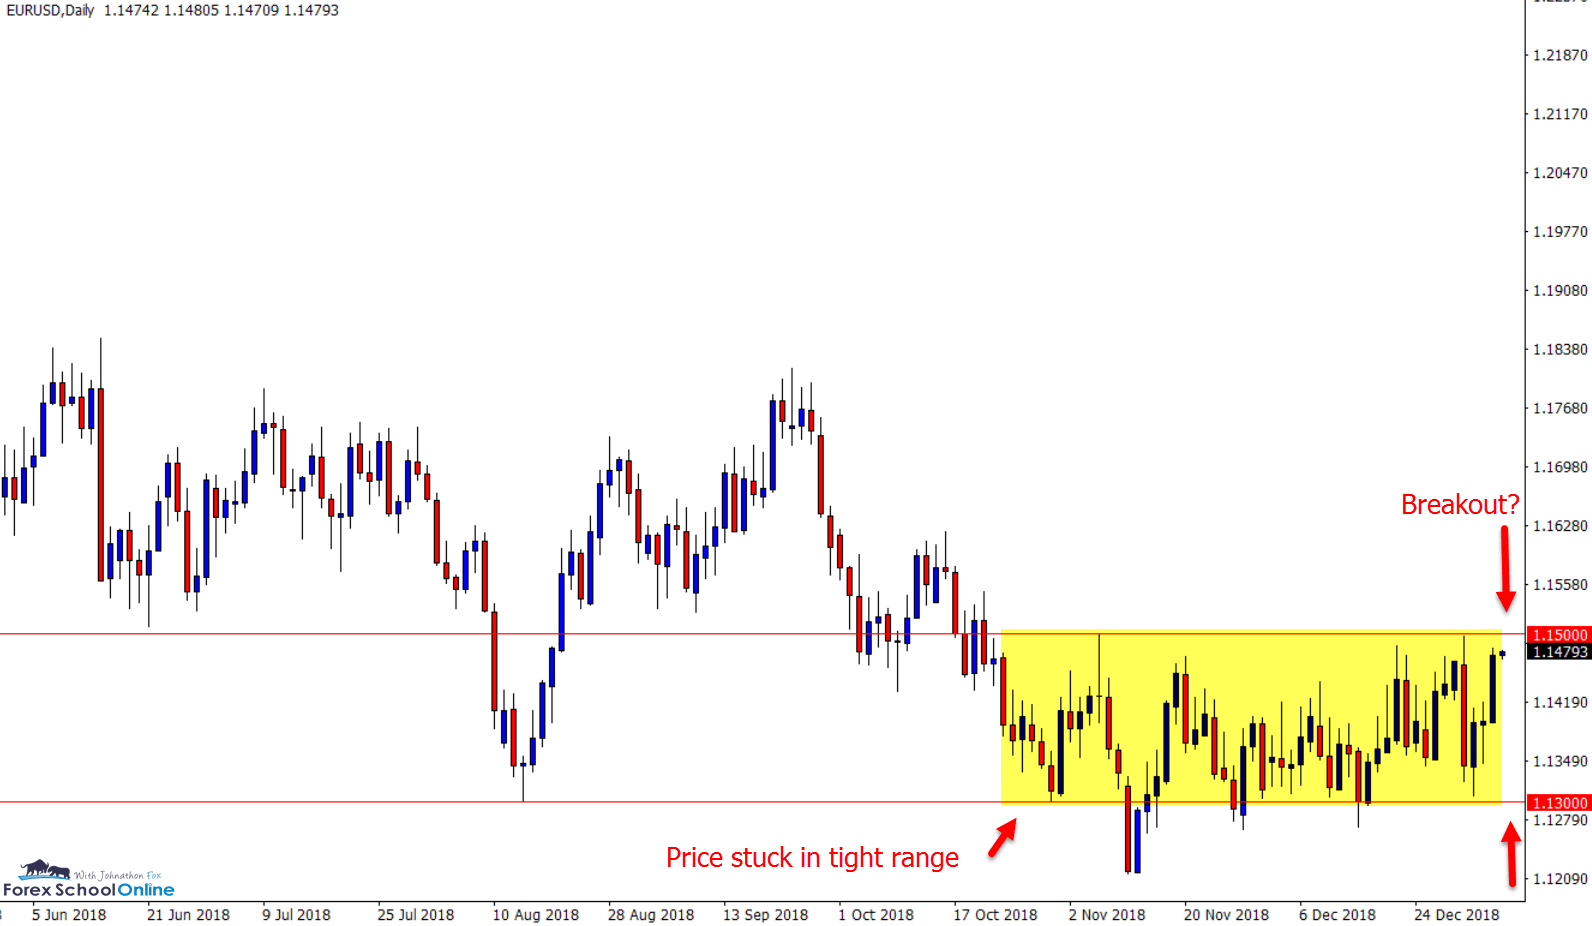
EURUSD Daily Chart
Price Stuck In Box Looking For Break
Price action on the EURUSD daily chart is stuck inside a tight ranging box with a clear high and low.
As the daily chart shows below; price is now looking to test the major high of this range and box with a potential break higher.
Trading inside these super tight box situations is incredibly difficult and can be very tricky as price has a tendency to whipsaw and make small erratic moves.
Once price breaks either higher or lower, it will then often open up a wide range of trading opportunities that can be a lot more fast paced including breakouts and looking for breakout and quick retrace trades.
Daily Chart
AUDUSD Daily Chart
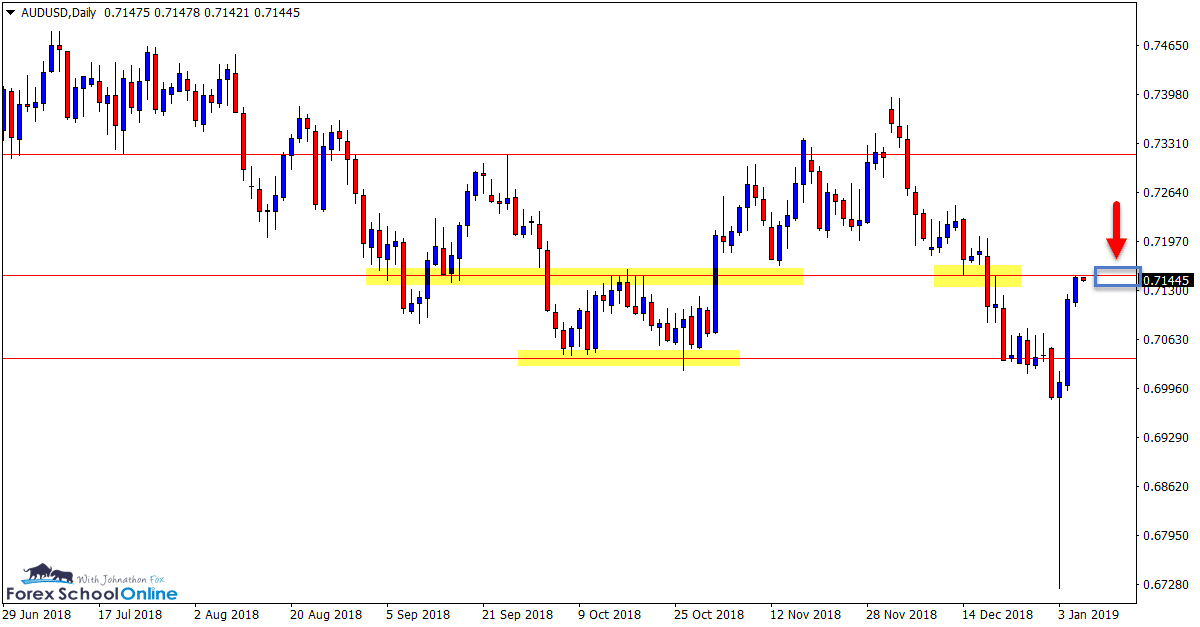
Huge False Break & Now Test
On many of the Asian markets that carry the AUD, JPY currency we have seen huge false breaks. These moves were looking like creating huge breaks only to snap right back.
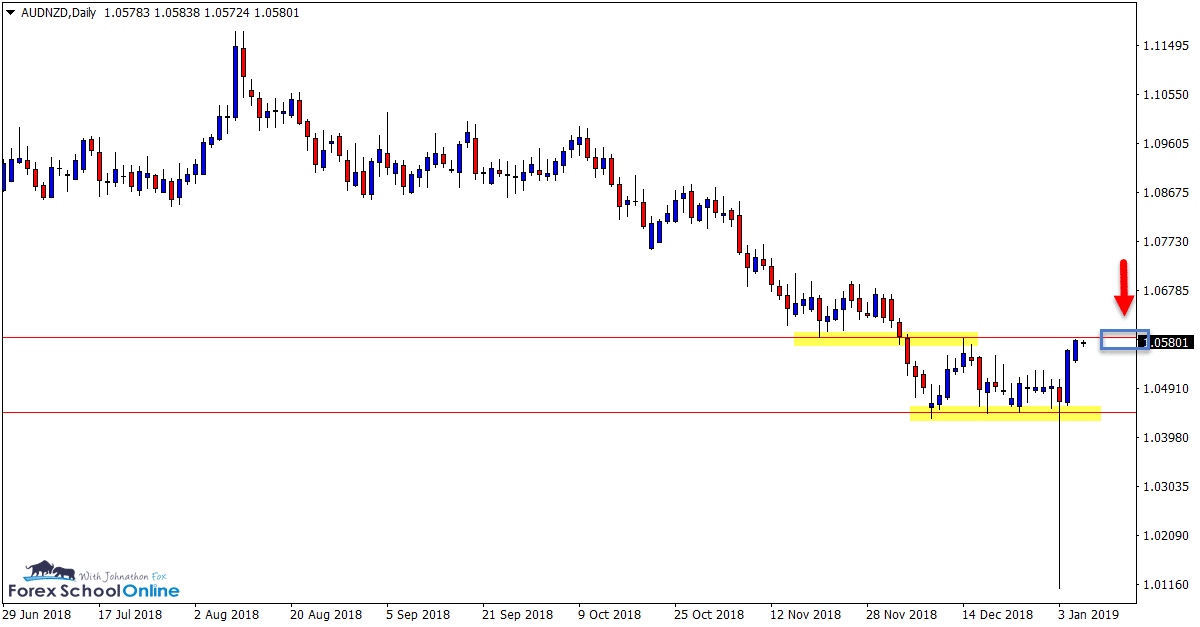
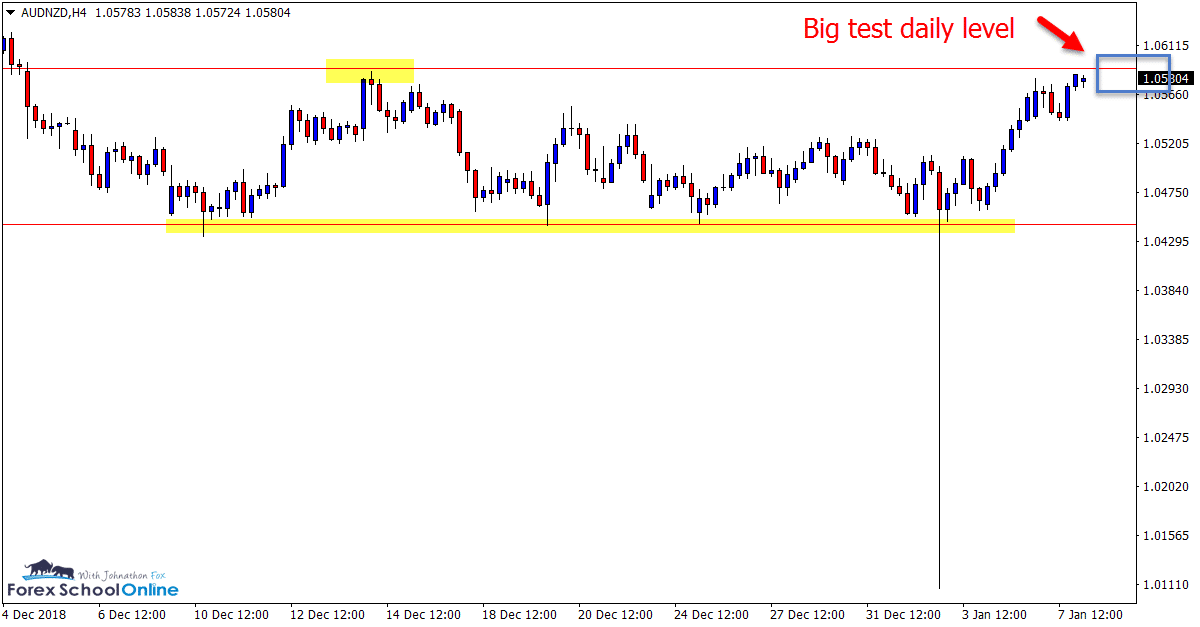
The AUDUSD and AUDNZD are good examples of these moves with both charts below.
We can see on the AUDUSD price has now snapped back higher and is looking to re-test the important price flip level we have discussed in previous summaries.
The same can be seen on the AUDNZD 4 hour chart with an incredibly important few sessions coming up at the major resistance level.
Daily Chart
Daily Chart
4 Hour Chart
BITCOIN Daily Chart
Stuck Between Two Levels
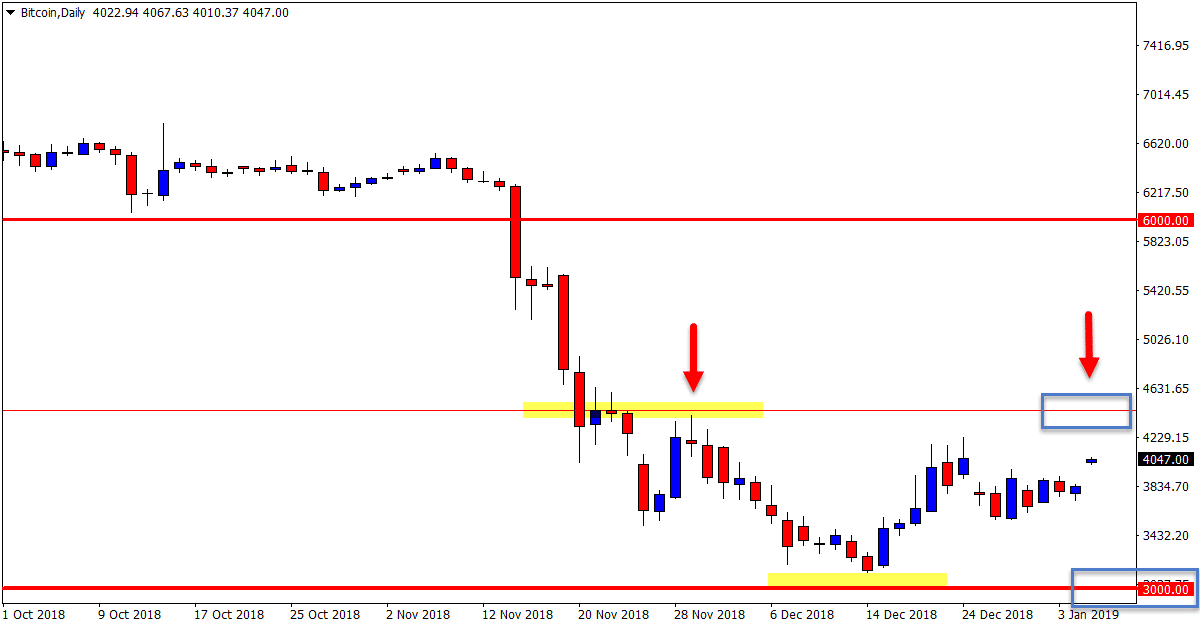
Price action in the Bitcoin market is stuck between the Very Big Round Number = VBRN and key daily resistance.
Price just at the moment is hovering around the support and resistance of 4000.
Price is in a sideways and consolidation pattern after a huge breakout and move lower after price broke the VBRN 6000. A price action consolidation will often occur after a large and aggressive move because no market can go straight higher or lower.
Bearish traders can look to find A+ trade setups if price fires off bearish signals at the major daily resistance level.
Lesson: The Rules to Price Action Moves
Daily Chart
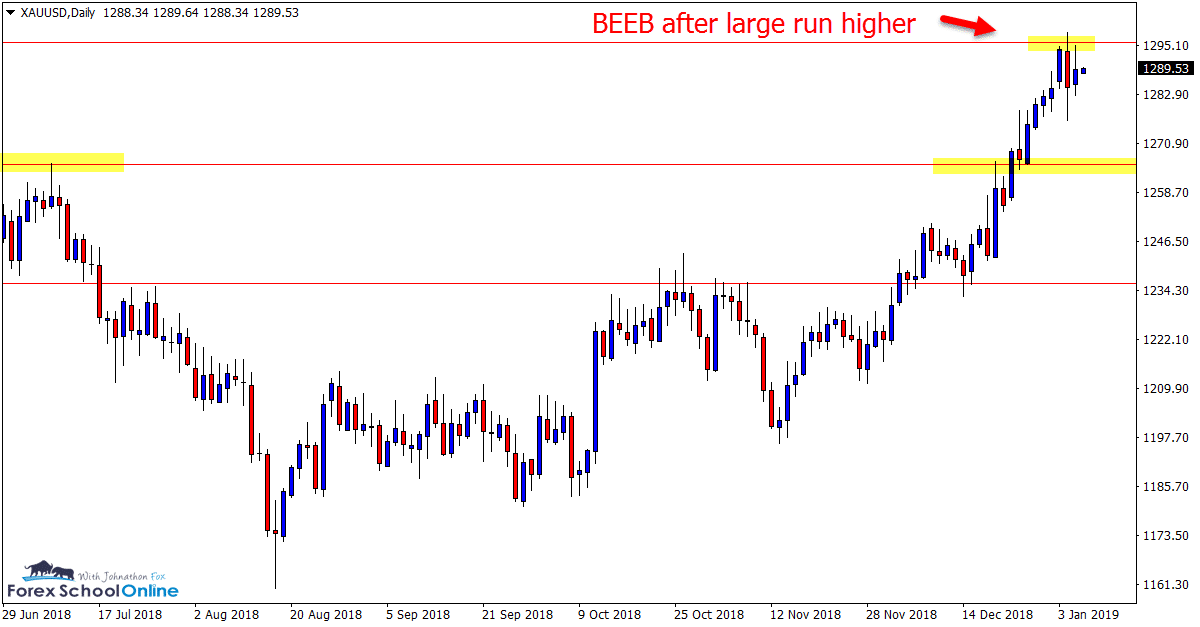
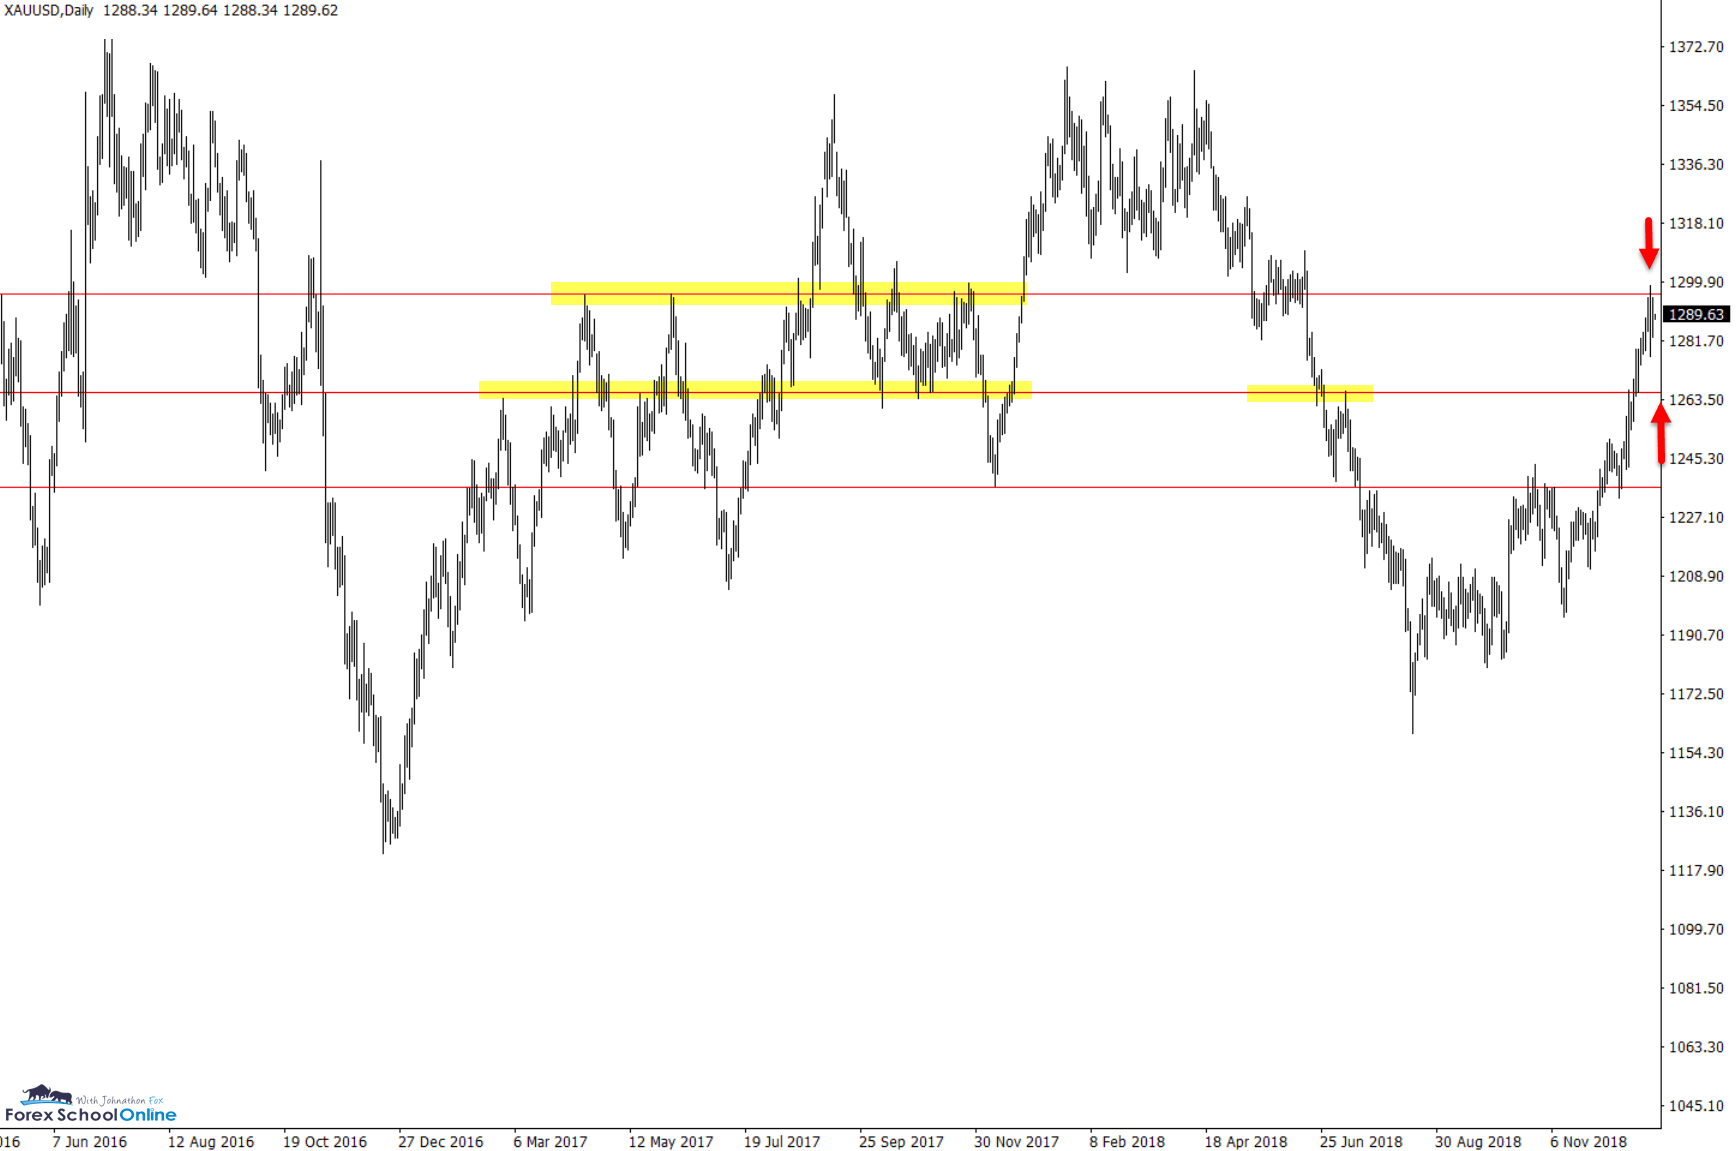
GOLD Daily Chart
Up-trend in Place
After discussing the Gold market in our last few summaries, the market reversal and short-term trend has taken shape.
In the summary we posted 18th December we discussed how price action formed a base and reversal in this market and was looking to move higher.
Price has now formed a Bearish Engulfing Bar = BEEB after a large run higher with a small pull-back.
If price does breakout and continue higher, price could move into the next box highs around the 1306 area. If price pulls back from the BEEB, bullish traders could look for A+ trades with the move higher around the major daily support level.
Daily Chart
Daily Chart
Note: We Use Correct ‘New York Close 5 Day Charts’ – Download Free New York Close Demo Charts Here
Charts in Focus Note: All views, discussions and posts in the ‘charts in focus’ are the view of Forex School Online and are not recommendations or trading advice. All posts are general in nature and are not advice to buy or sell.
Please leave questions or comments in the comments section below;


Thanks johnathon love ya work mate.
Thanks Steve!
Next one up tomorrow.
Johnathon