Weekly Price Action Trade Ideas – 5th to 9th Oct 2020
Markets Discussed in This Week’s Trade Ideas: US500, GOLD, GBPUSD and NZDUSD.
Note: We Use Correct ‘New York Close 5 Day Charts’ – You can read about why we use these and how to download the correct free charts at Correct Free New York Close Demo Charts
US500 Daily Chart
-
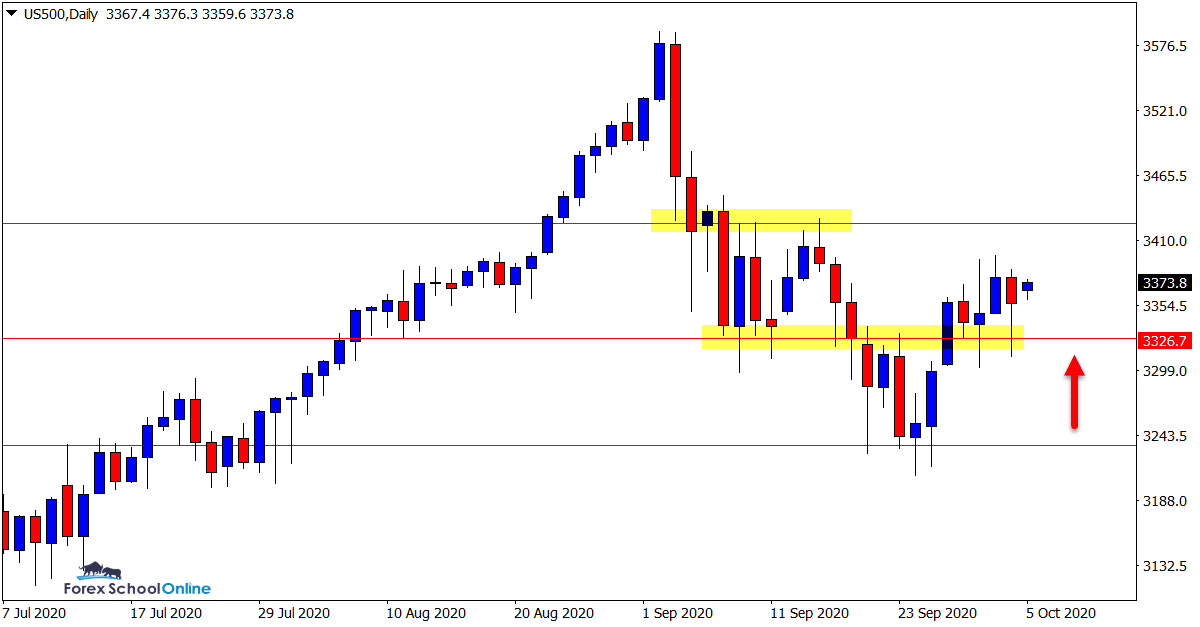
Daily Support Holding
The daily chart resistance level we highlighted last week has now been broken and is looking to hold as a price flip support level.
As the attached chart shows; price has broken above this level and has formed a candle with a lower wick rejecting this level.
If price follows through with this momentum we can look for the next resistance level around 3424.45 to be tested and then a potential further extended leg higher.
Daily Chart

GOLD Daily Chart
-
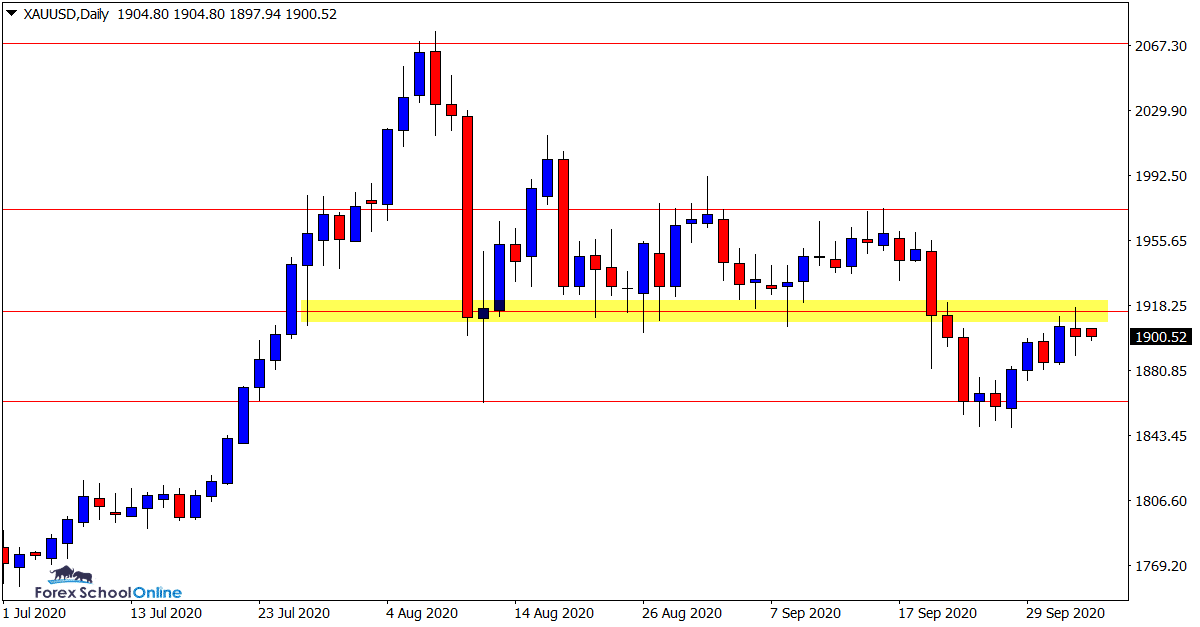
Price Flip Resistance in Play
This is an interesting market. Whilst there are plenty of bulls getting around, the uptrend that was in place earlier in the year has well and truly stalled.
Price has now moved higher on the daily chart into an important level.
As the daily chart shows; this level was the previous support level that held price higher before price broke out lower.
Price is now retesting this level as a new price flip resistance.
If this level holds we could look for an extended leg lower and new potential short trades.
Daily Chart

GBPUSD Daily Chart
-
Will GBPUSD Continue to Range?
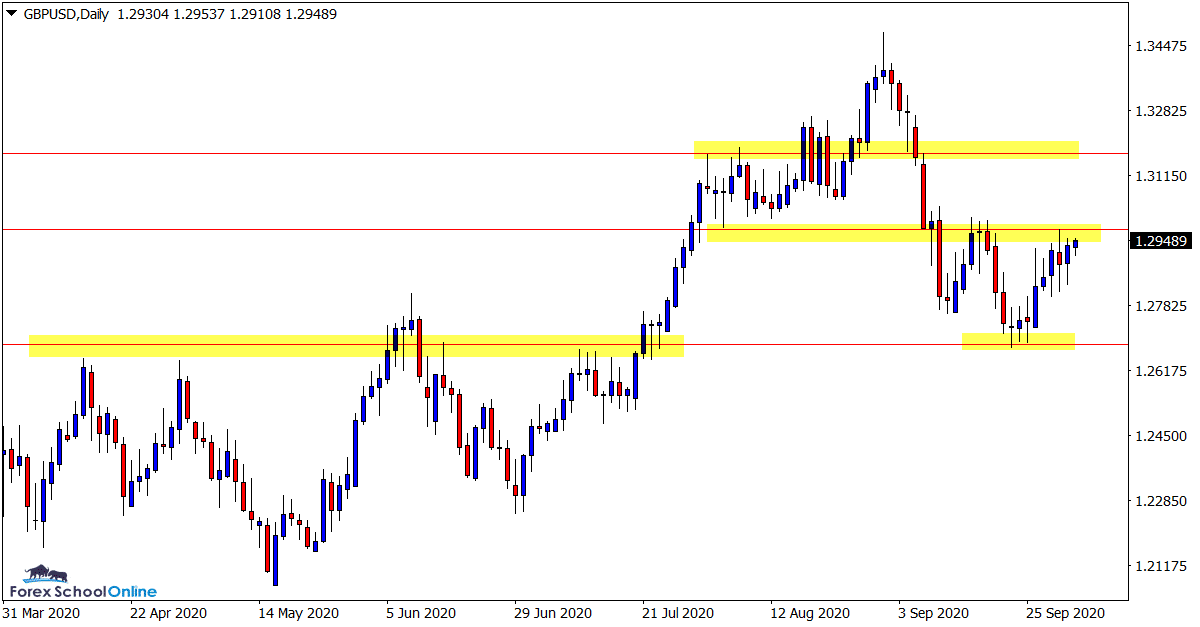
A range has been building on the GBPUSD in recent sessions.
With the recent uncertainty with US pairs it remains to be seen how this will play out in the next few sessions which makes the daily resistance a key watch.
If the daily chart resistance holds in the next few sessions, then the range would be in play and we could begin to look to trade both sides of the markets.
This would include short trades from the daily resistance and long trades as price swings lower into the range support level.
Daily Chart

NZDUSD Daily Chart
-
Long-term Uptrend to be Tested
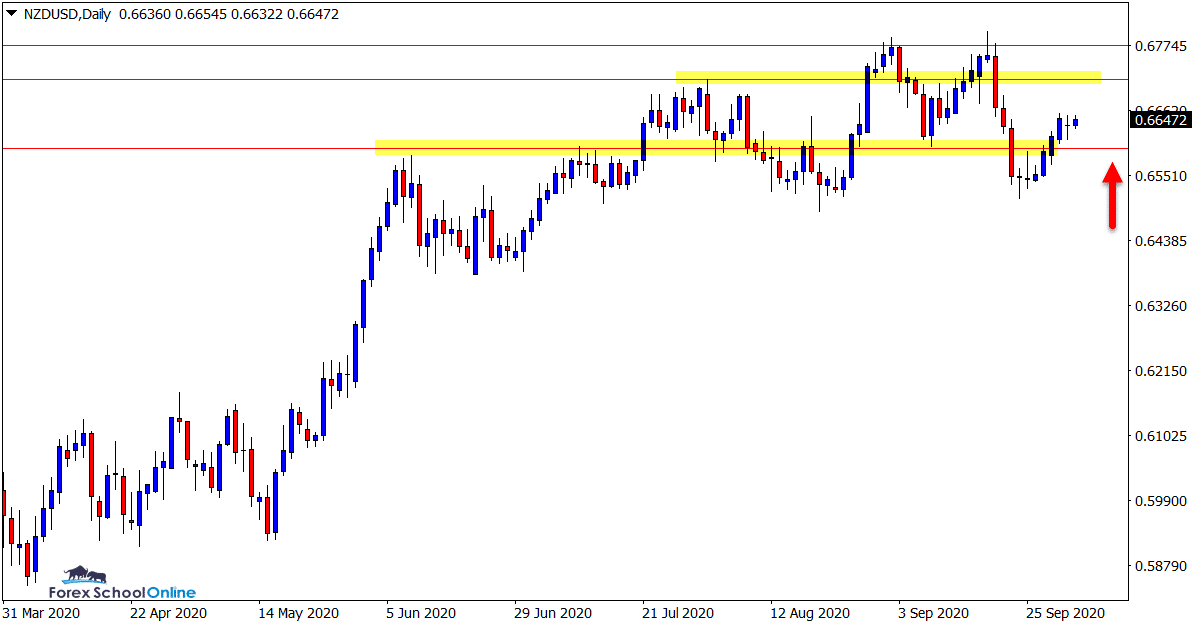
There is a longer term daily chart uptrend in place in this market, but just how strong the bulls are will be tested this week.
There are two key resistance levels that price will soon be running into and will be a real test for any strong moves higher.
These levels will present aggressive counter-trend traders opportunities to look for short and sharp trades against the overall trend.
For conservative trend traders, you can look for price to make a rotation into the daily support level to get long with the trend.
Daily Chart

Trade Ideas Note: All views, discussions and posts in the ‘charts in focus trade ideas’ are the view of Forex School Online and are not recommendations or trading advice. All posts are general in nature and are not advice to buy or sell.
Note: We Use Correct ‘New York Close 5 Day Charts’ – You can read about why we use these and how to download the correct free charts at Correct Free New York Close Demo Charts
Please leave questions or comments in the comments section below;


Leave a Reply