Weekly Price Action Trade Ideas – 4th to 8th Nov 2019
Markets Discussed in This Week’s Trade Ideas: USDJPY, GBPCHF, USDSGD and GOLD.
Note: We Use Correct ‘New York Close 5 Day Charts’ – You can read about why we use these and how to download the correct free charts at Correct Free New York Close Demo Charts
USDJPY Daily and 4 Hour Charts
Large Pin Bar / Engulfing Bar Sends Price Lower
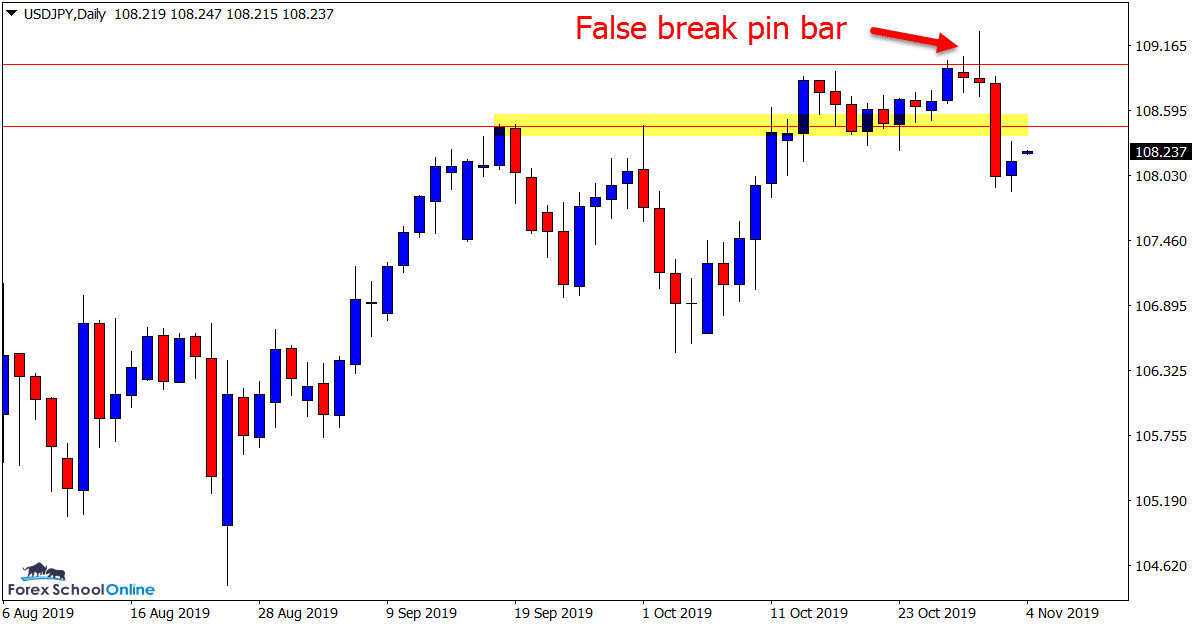
The last time we looked at this market in the trade ideas we were looking to see if price could breakout higher and into the 109.00 area.
After breaking higher and popping above the 109.00 resistance price formed a large false break that has seen price once again move back lower and below a key level.
Whilst there looks to be a bunch of minor levels in this market, the near term resistance directly overhead could be the key.
If price rotates higher and this level holds as a price flip resistance it could see price sell off lower.
Daily Chart
4 Hour Chart

GBPCHF Daily Chart
Prolonged Windup Ready for Large Breakout
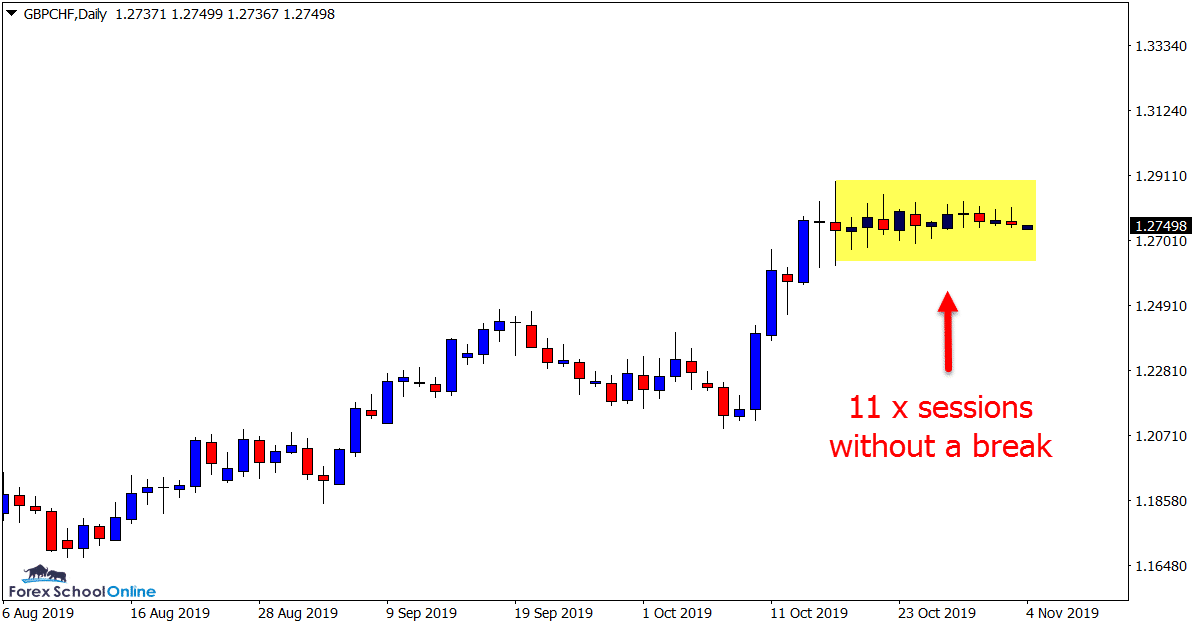
Similar to a lot of the GBP pairs at the moment such as the GBPJPY and EURGBP, the GBPCHF is going through a prolonged consolidation period.
This is not surprising given what is happening in the world just at the moment. As has been highlighted on the daily chart below; price has been stuck unable to break the daily candles high or low for the last 11 sessions.
When these extended windup periods occur the breakout we see will often be fast and aggressive as a lot of traders will be sitting on the sidelines until the break finally takes place.
Daily Chart
USDSGD Daily and 4 Hour Charts
Price Looking to Continue Move Lower
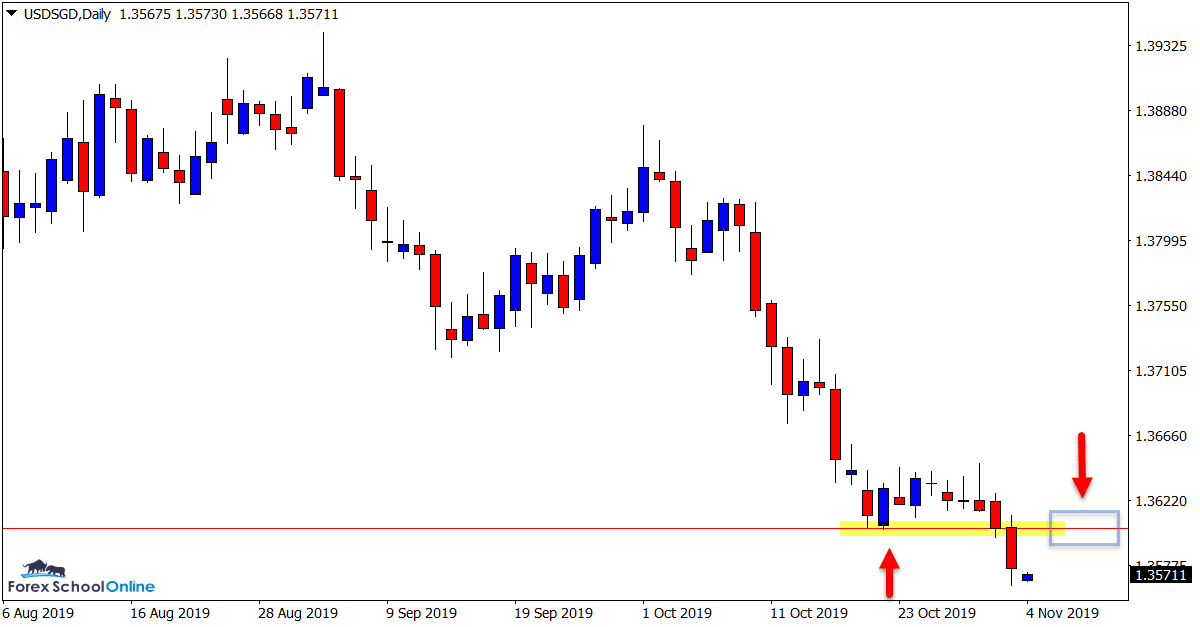
For the past two months price in this market has been selling off aggressively lower.
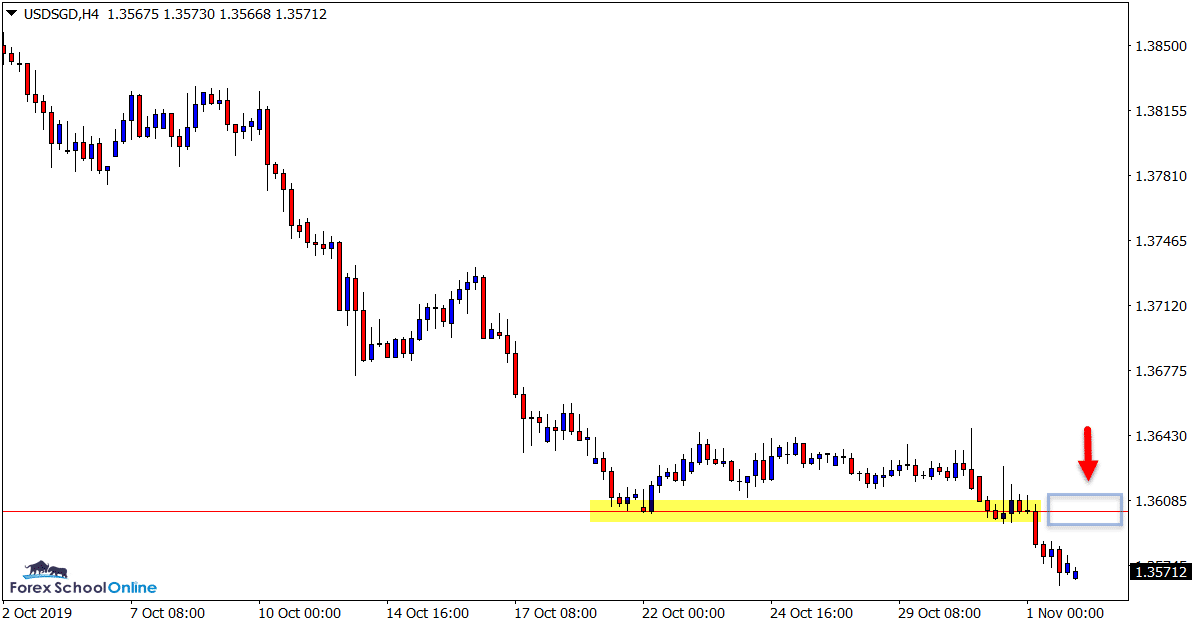
After a brief period over the last week where price paused sideways in a consolidation box, price has once again broken lower to continue the move.
The support that price has just broken looks to be an interesting level to watch over the coming sessions. If price can rotate higher this level could hold as a new price flip resistance and a level to look for potential high probability bearish trigger signals.
Daily Chart
4 Hour Chart
GOLD Daily Chart
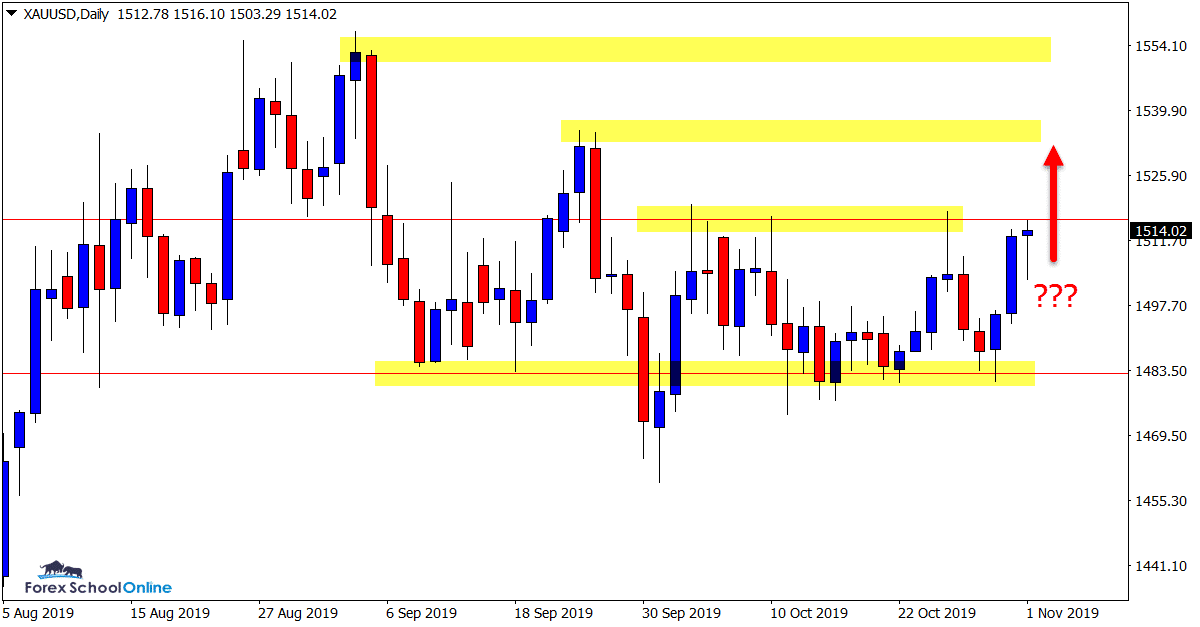
Another Test of Daily Resistance
This is a market we have been charting closely in recent times as it has been producing some interesting price action.
After forming a series of lower highs and looking to make a major test of the daily support level, price has so far held strongly.
Last week we had a bearish pin bar that again sent price back into the support level that once again held.
Price is now looking to test the resistance that could prove key for this markets next move. A breakout higher and we could see price look to test the recent swing high and potentially the highs of September.
Daily Chart
Trade Ideas Note: All views, discussions and posts in the ‘charts in focus trade ideas’ are the view of Forex School Online and are not recommendations or trading advice. All posts are general in nature and are not advice to buy or sell.
Note: We Use Correct ‘New York Close 5 Day Charts’ – You can read about why we use these and how to download the correct free charts at Correct Free New York Close Demo Charts
Please leave questions or comments in the comments section below;


Leave a Reply