Weekly Price Action Trade Ideas – 4th to 8th May 2020
Markets Discussed in This Week’s Trade Ideas: EURUSD, AUDSGD, EURAUD and US500.
Note: We Use Correct ‘New York Close 5 Day Charts’ – You can read about why we use these and how to download the correct free charts at Correct Free New York Close Demo Charts
EURUSD Daily Chart
2 Bar Pushes Higher
In last week’s trade ideas we were looking at the 2 bar reversal and what would happen around the major daily support level that had just been tested.
After breaking above the bullish 2 bar reversal price moved back higher and now looks to test the immediate resistance.
Whilst there have been some large moves in this pair this year, price is still ranging without a clear trend.
This range along with the fairly clear support and resistance levels allow trading both sides of the market when high probability trigger signals form at the major support or resistance levels.
Daily Chart

EURAUD Weekly and Daily Charts
Watching Close Resistance
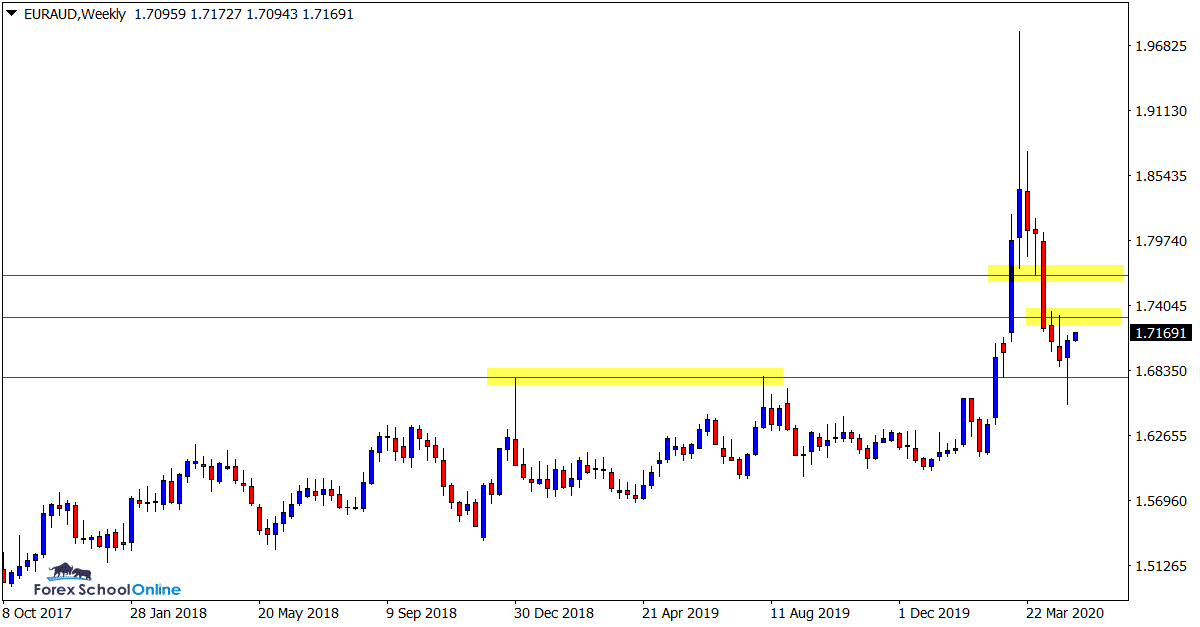
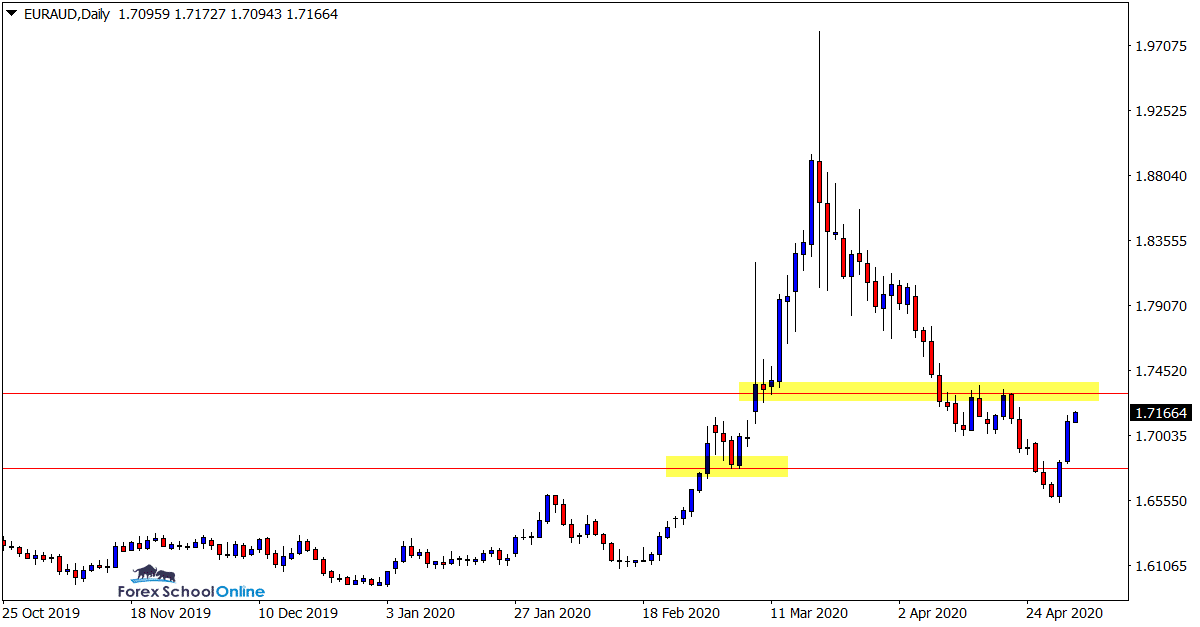
After a huge sell off lower price finally moved back into the major support level and popped higher.
As the weekly chart shows below there is a bullish pin bar that rejects this long term support level.
This looks a tricky market because just overhead is a box resistance area that price would need to move into and break higher through to make a sustained move higher.
Weekly Chart
Daily Chart
AUDSGD Weekly and Daily Charts
Weekly Pin Bar
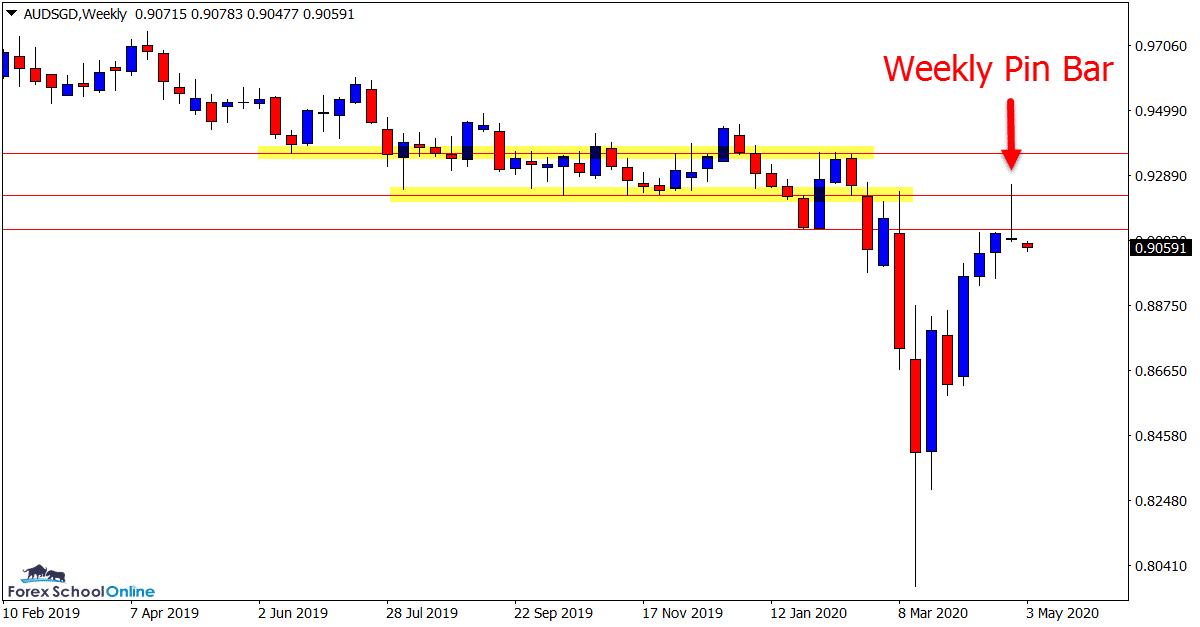
Similar to the EURAUD, the AUDSGD has also formed a weekly pin bar, just inverse.
We discussed this market recently and the many resistance levels price had coming up.
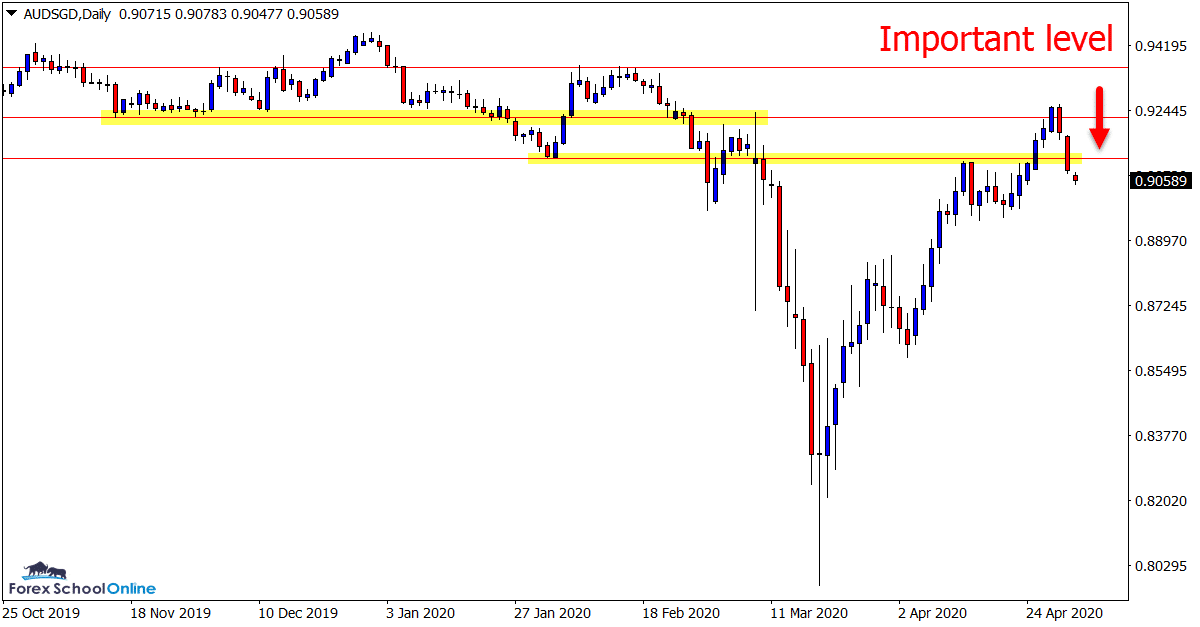
The resistance level that price has made a false break through now looks to be crucial for this market.
If this level holds as a resistance, then the next solid move lower could come into play. This level could also be a potential area to hunt smaller time frame trades with A+ trigger signals.
Weekly Chart
Daily Chart
US500 Weekly and Daily Charts
False Break of Resistance
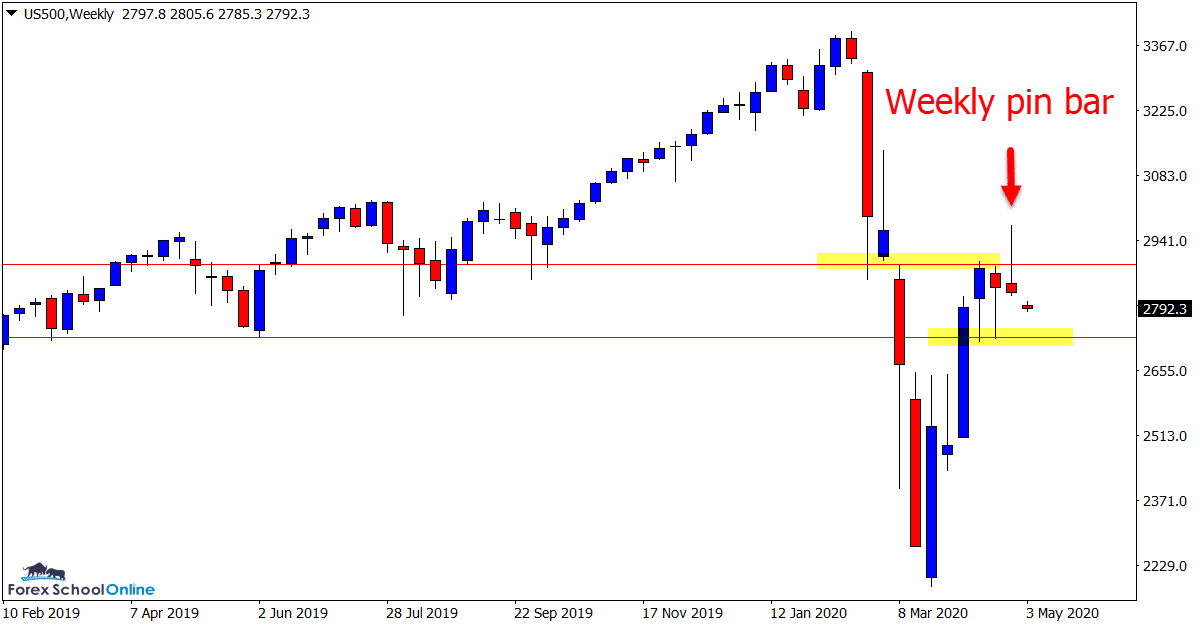
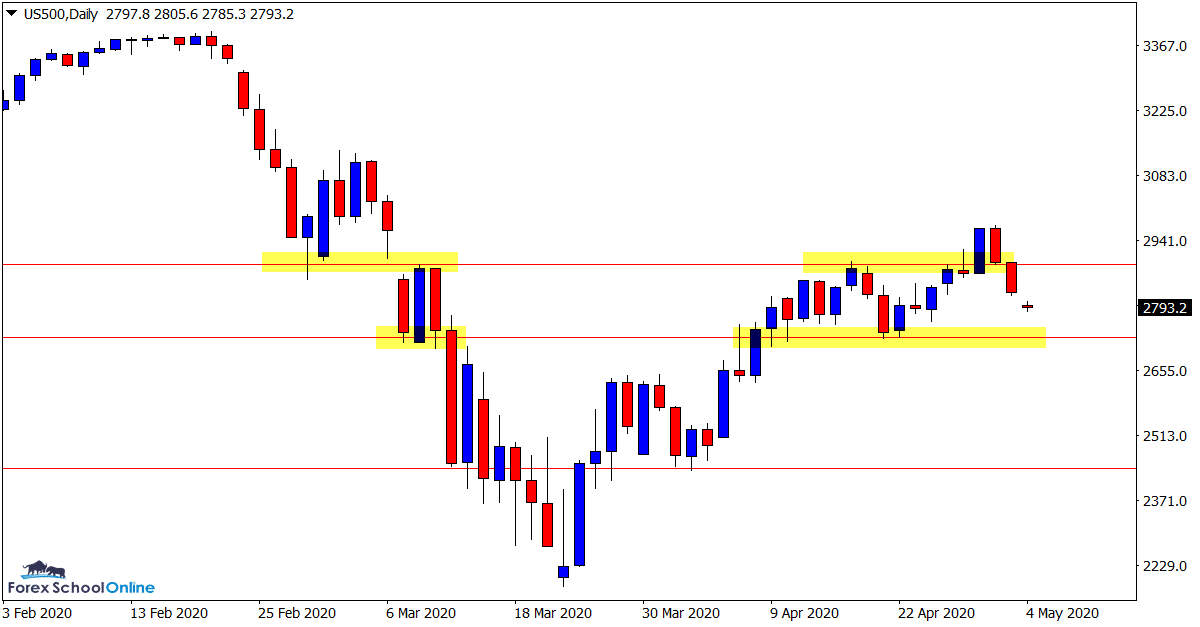
In the past week there have been a lot of false breaks or attempted breakouts that had little follow through.
This is being seen in many markets at the moment as price is uncertain where it wants to go.
Whilst the weekly chart of this market shows a large false break pin bar, the daily chart highlights the uncertainty.
Price on the daily chart tested the resistance level and formed a false break pin bar. Price was not able to confirm the pin bar and move lower and we saw the large false break follow.
Weekly Chart
Daily Chart
Trade Ideas Note: All views, discussions and posts in the ‘charts in focus trade ideas’ are the view of Forex School Online and are not recommendations or trading advice. All posts are general in nature and are not advice to buy or sell.
Note: We Use Correct ‘New York Close 5 Day Charts’ – You can read about why we use these and how to download the correct free charts at Correct Free New York Close Demo Charts
Please leave questions or comments in the comments section below;


Thanks for the timely ideas, they really help alot.
Regards