Weekly Price Action Trade Ideas – 3rd to 7th June
Markets Discussed in This Week’s Trade Ideas: USDJPY, AUDNZD, EURCAD and CADCHF.
AUDNZD Daily Chart
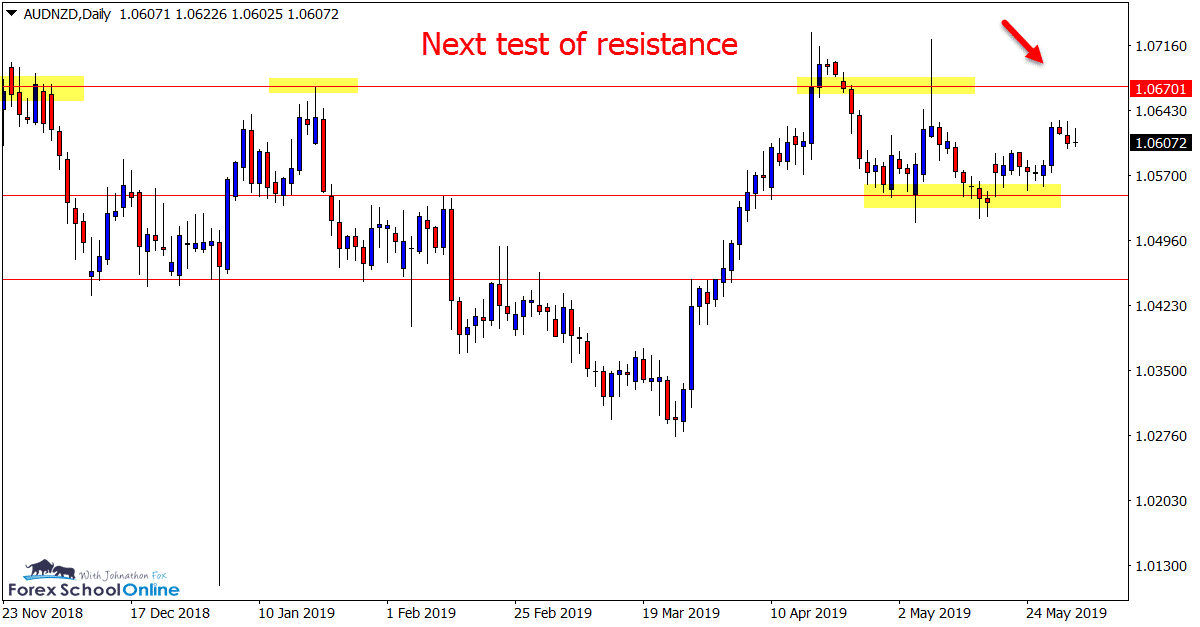
Price Moving Into Daily Resistance
In our recent trade ideas we discussed the very large pin bar price had formed on the daily chart of this pair.
At the time I spoke about how it would have been a little nicer if price formed up higher, at more of a swing high and with a bit more room to fall into.
The pin bar is still in play, but price has so far held at the daily support and is now looking to make a test of the overhead resistance.
This level could be a solid level to look for short trades and it will be an important level for where price makes its next major move.
Daily Chart
USDJPY Daily and 4 Hour Charts
Possible Re-test Old Support / New Resistance
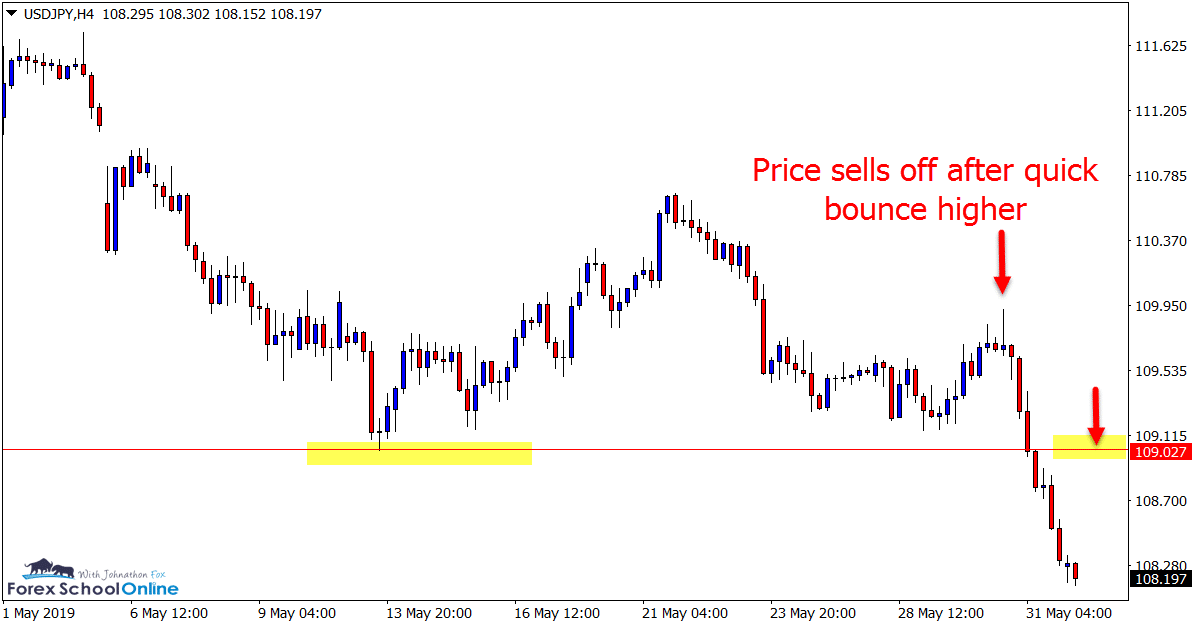
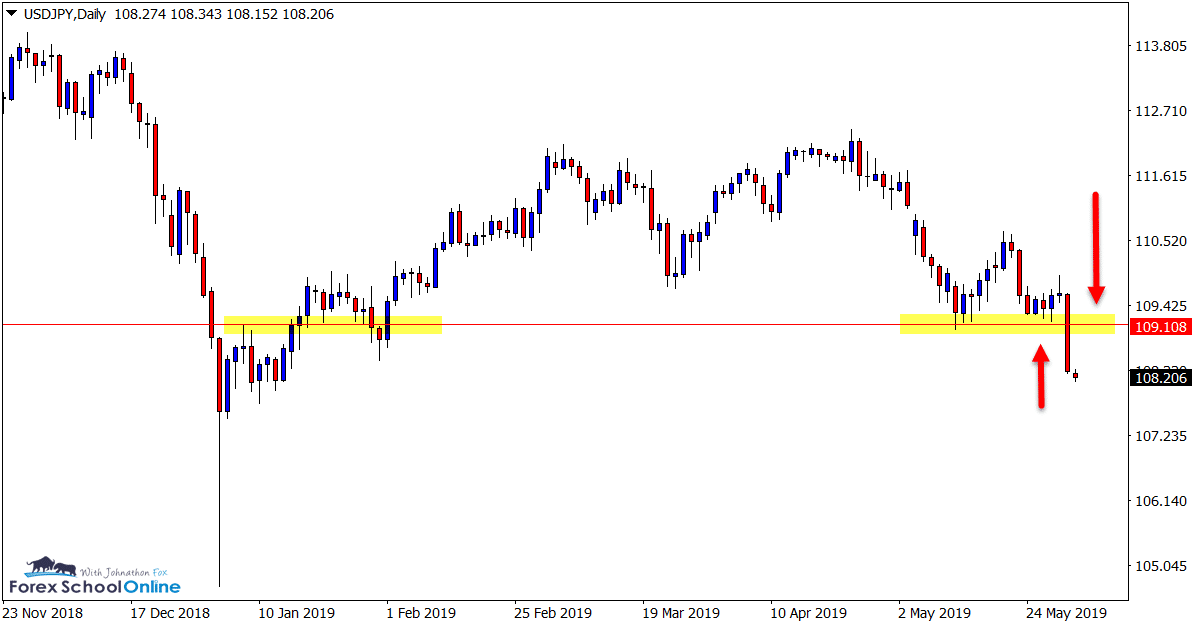
In last week’s trade ideas we were looking to see if the daily support level would hold or break. Whilst price paused, found support and popped higher, as the 4 hour chart clearly shows below; it has since reversed and slammed through the major daily support level.
The momentum is all lower at the moment and if price could retrace higher it could open the way for potential short trades.
If we can see price rotate back into the old support and potential new resistance, bearish traders could look for short trades should any bearish trigger signals fire off.
Daily Chart
4 Hour Chart
EURCAD Daily Chart
Stuck in Sideways Traffic
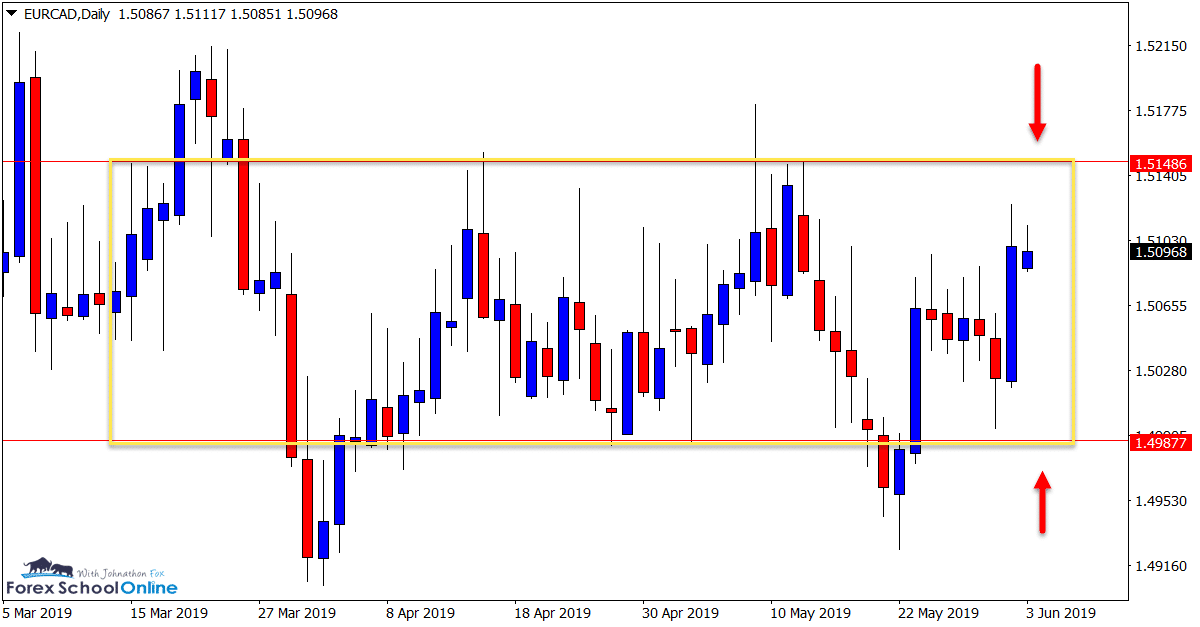
The EURCAD is stuck in a clear sideways box and traffic jam.
These markets are a nightmare to play at the best of times because even if you do pick the correct direction you are likely to be whipped out before price makes you a winner.
If you insist of playing these types of ranging markets, the best plays are from the range highs and lows.
Daily Chart
CADCHF Daily Chart
Testing Major Support
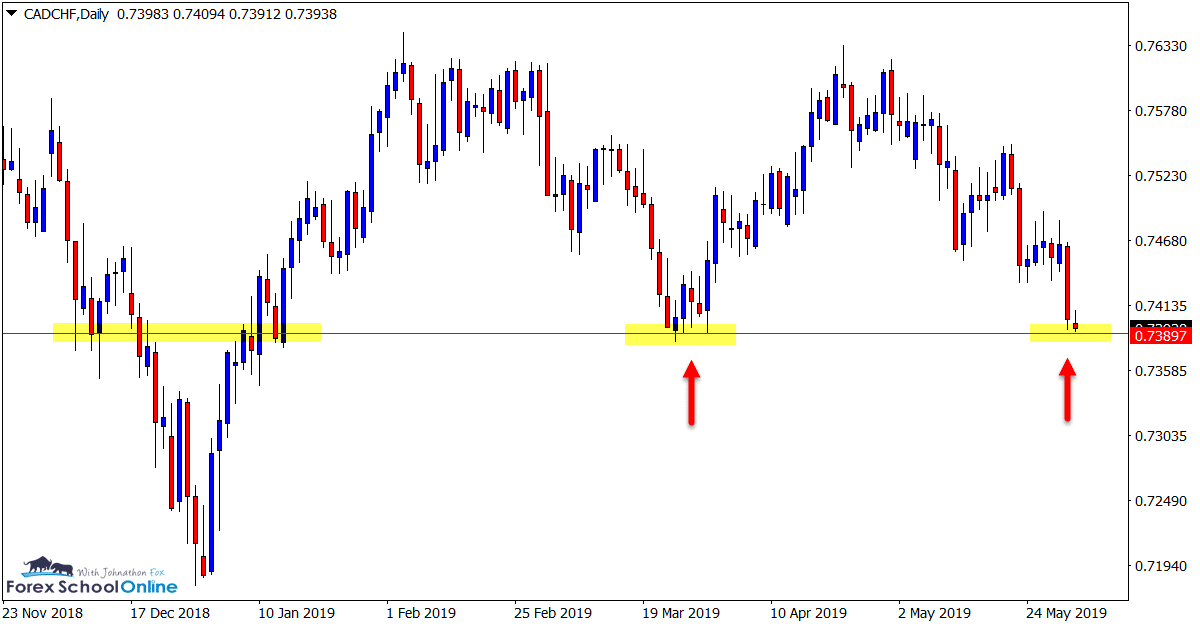
Price has slammed lower in recent sessions to now be testing the crucial daily support level.
Whilst price has moved lower in very recent times, there is still no clear trend or bias on the daily chart lending this market to being played both ways.
If price holds at the support with a clear bullish trigger to get long it could open the way for high probability bullish entries, but we could also watch for the momentum to continue lower and for a quick break and intraday re-test setup.
Daily Chart
Note: We Use Correct ‘New York Close 5 Day Charts’ – You can read about why we use these and how to download the correct free charts at Correct Free New York Close Demo Charts
Charts in Focus Note: All views, discussions and posts in the ‘charts in focus’ are the view of Forex School Online and are not recommendations or trading advice. All posts are general in nature and are not advice to buy or sell.
Please leave questions or comments in the comments section below;


Leave a Reply