Weekly Price Action Trade Ideas – 3rd Dec 2018
Markets Discussed Today: EURAUD, AUDSGD, EURNZD & USDSGD
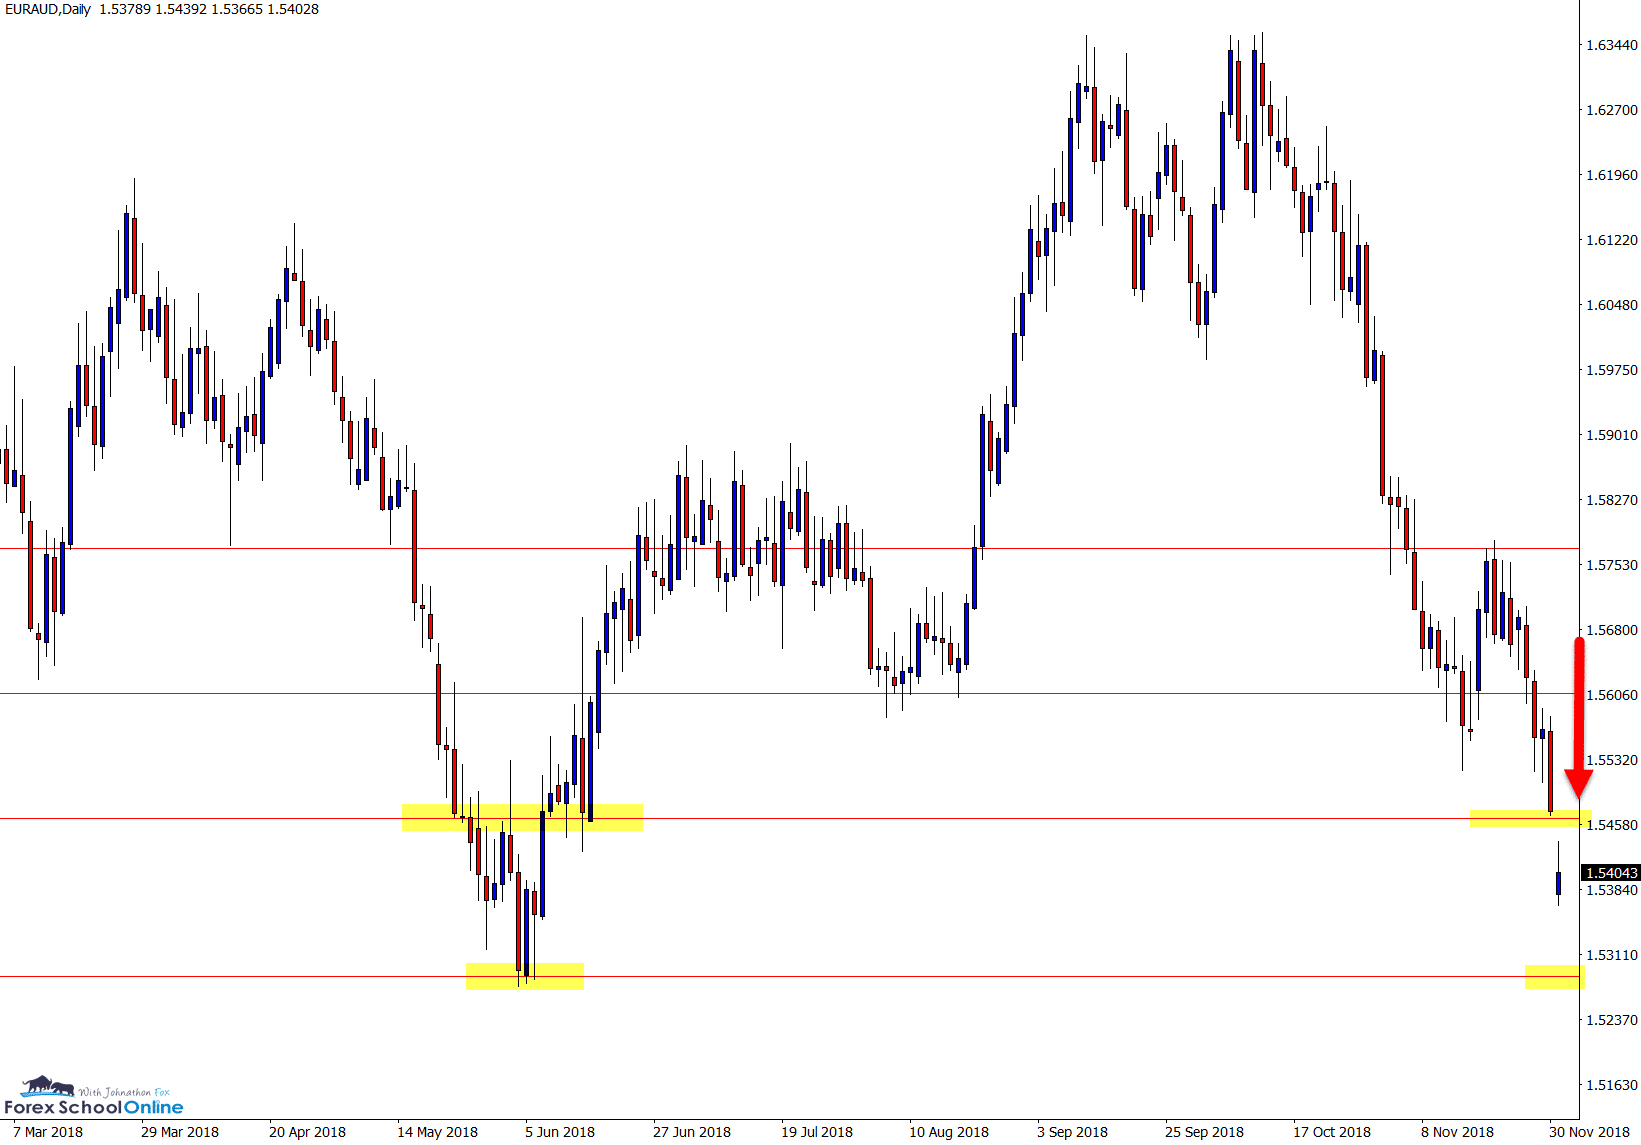
EURAUD Daily Chart
Support Broken From BEEB
After breaking the lows of the Bearish Engulfing Bar we discussed on this pair in last weeks summary, price has smashed lower and through the key support for this market.
As we highlighted last week; for any substantial moves lower to take place, the support needed to be successfully broken.
After such a strong breakout lower and move to the downside, price could rotate higher back into value and look to test the old support and new resistance area.
This could provide potential short trade opportunities if price fires off high quality bearish trigger signals to get short.
Daily Chart
AUDSGD Daily & 5 Min Chart
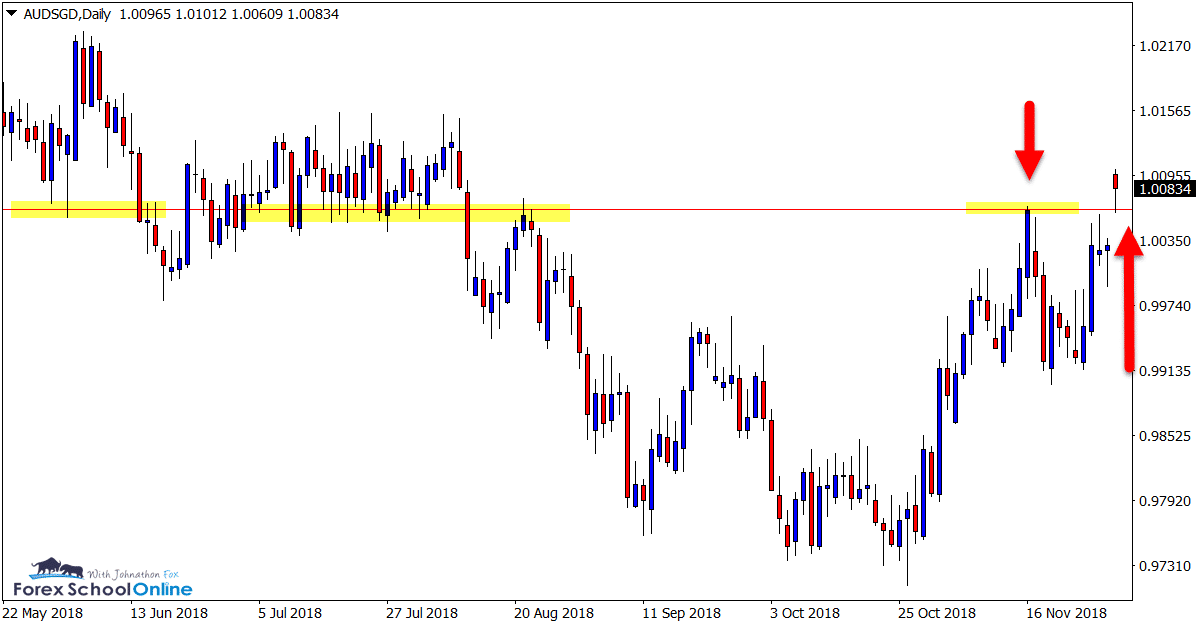
Breaks Higher, Retraces & Rejects
There has been a lot happening at the open of the market this week with a lot of markets opening with large gaps.
The AUDSGD is no different with price opening with a large gap higher. As is often the case after a gap; price quickly retraced lower looking to find the near term support.
Gaps are regularly not closed for extended periods. When a quick retrace does occur price will often move back into the closest support or resistance before continuing with the break and move it was already on.
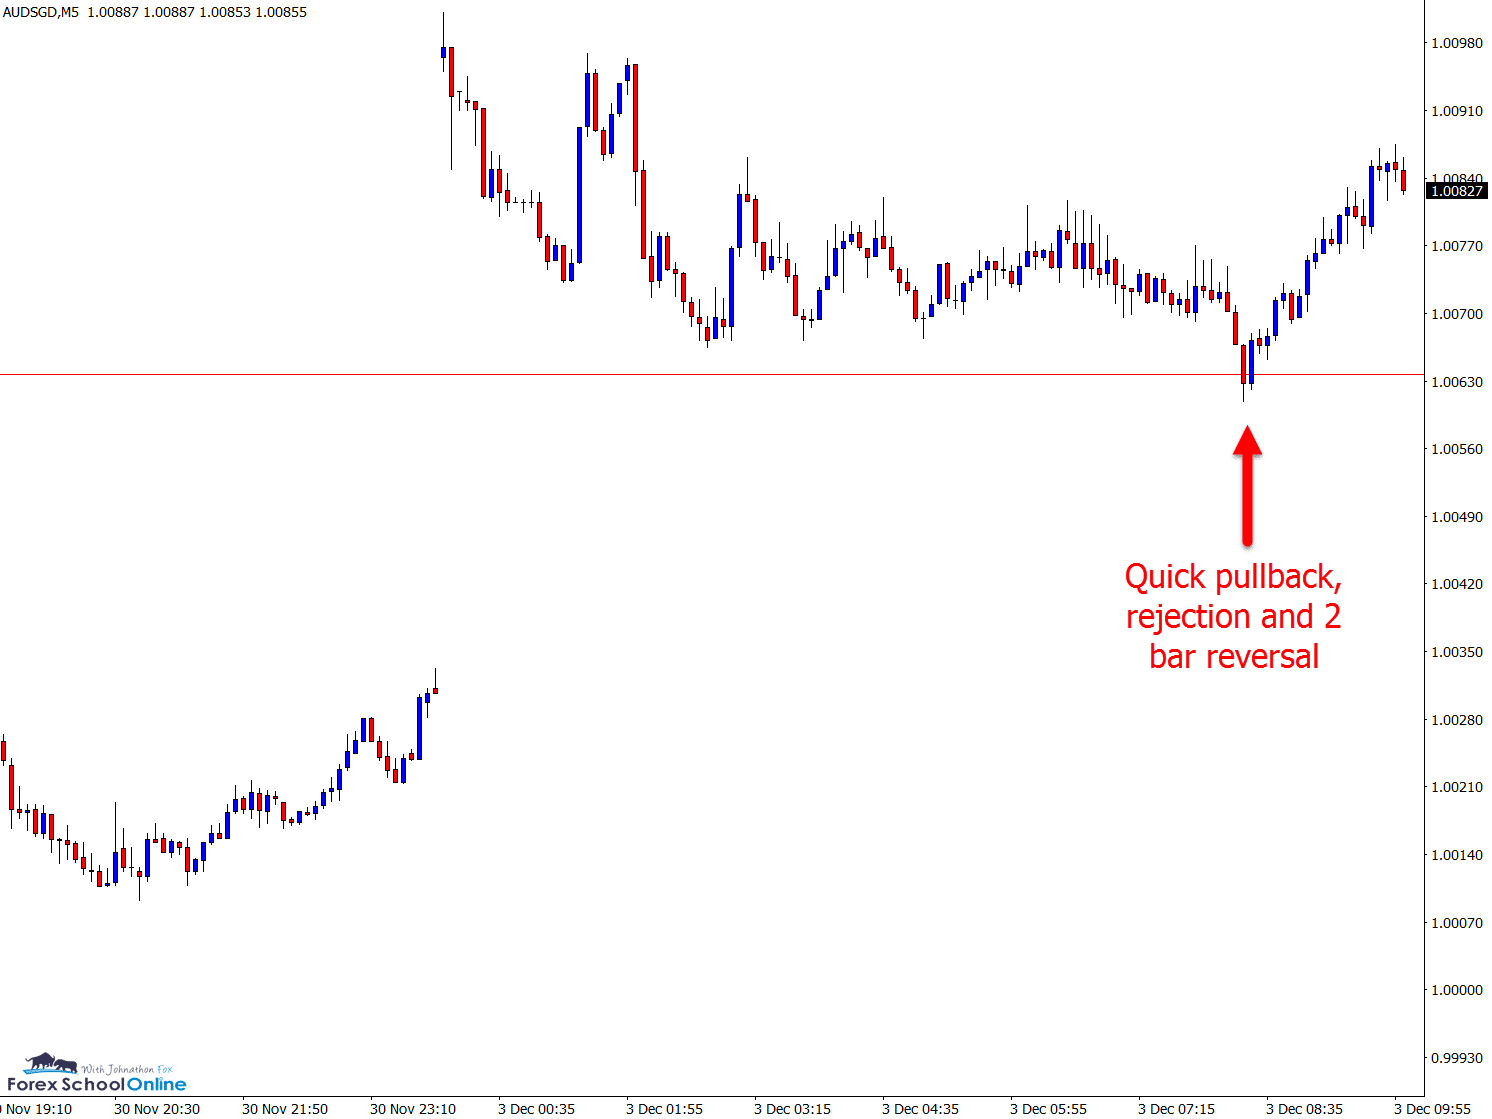
Price in this market quickly rotated lower into the near term support before rejecting and continuing on its way back higher.
The 5 minute chart shows this best with a 2 bar reversal rejecting the same daily level. I do not trade below the 15 minute chart, but this smaller time frame chart shows the price action taking place nicely.
Daily Chart
5 Minute Chart
EURNZD Daily & 4 Hour Charts
Long-term Support Broken
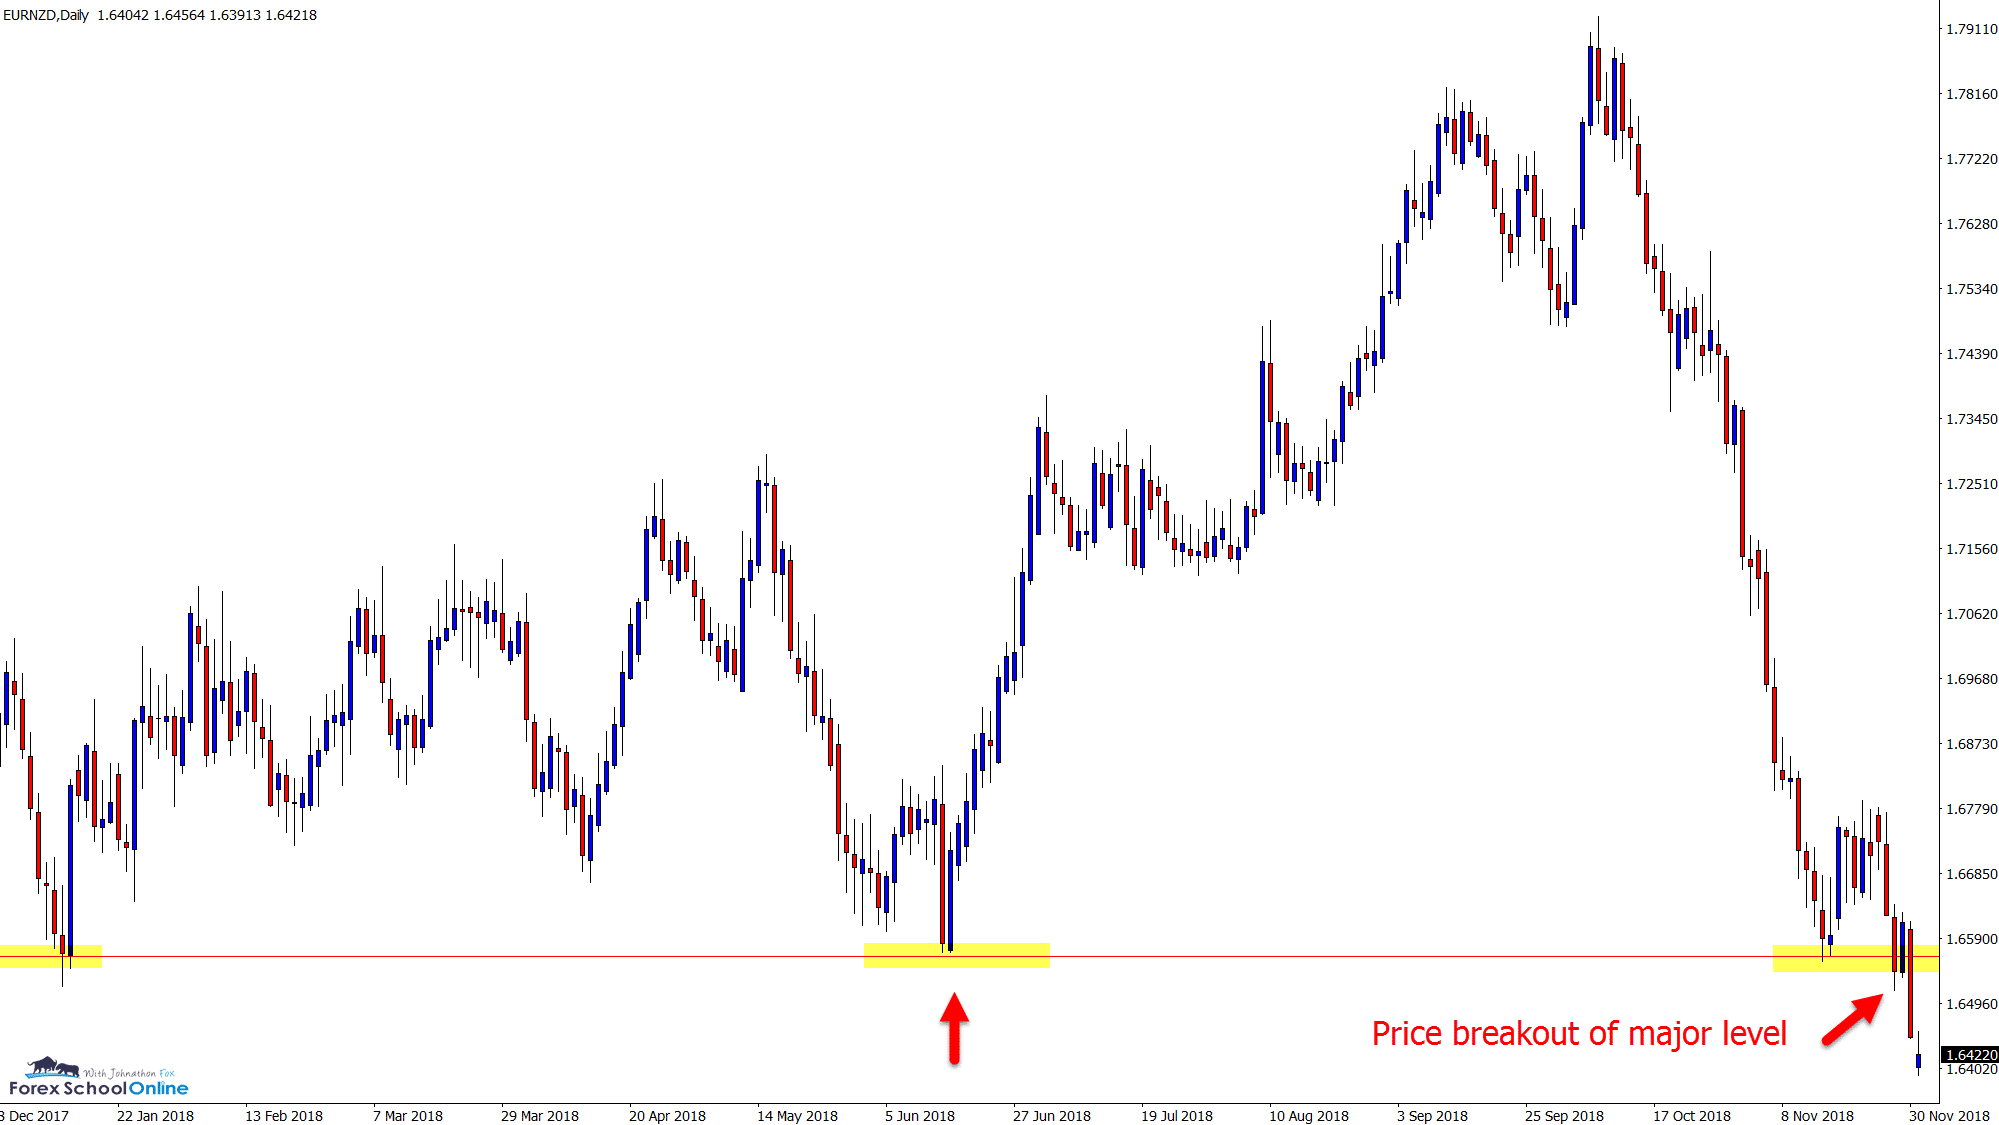
In the last two months price in this market has been absolutely decimated.
The daily chart below shows price making one way traffic lower with very little in the way of pull-backs higher.
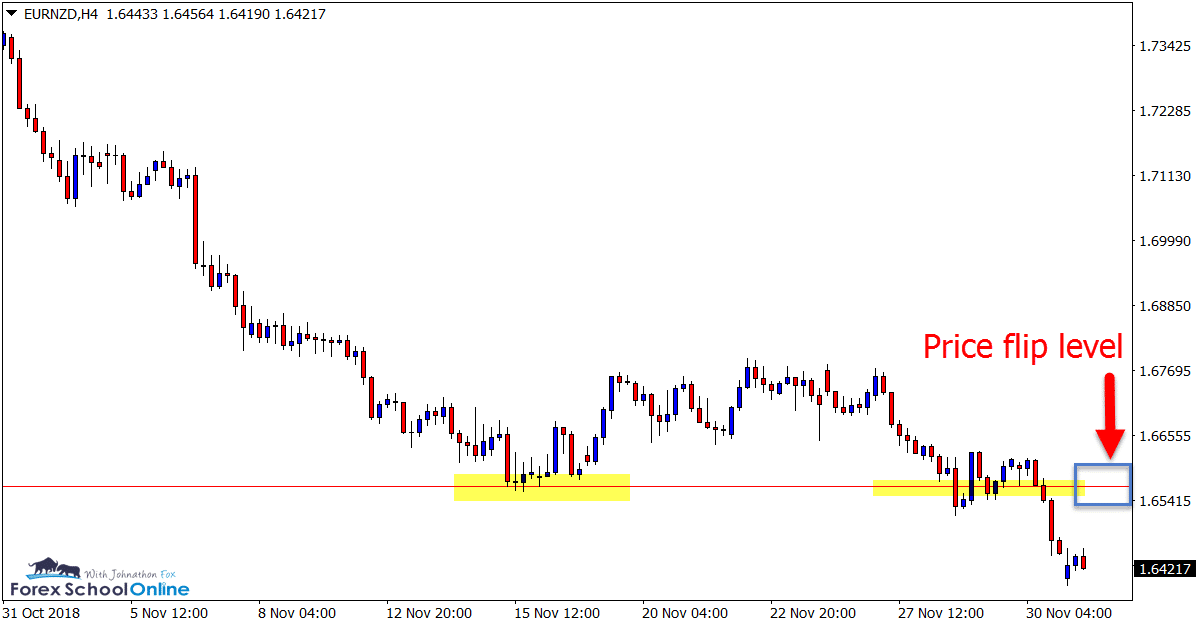
This move has now continued with price smashing through the major daily chart support level.
If price can make a rotation higher and back into the overhead old support and new resistance, then looking for potential short trades would be trading inline with the strong recent trend and momentum.
Daily Chart
4 Hour Chart
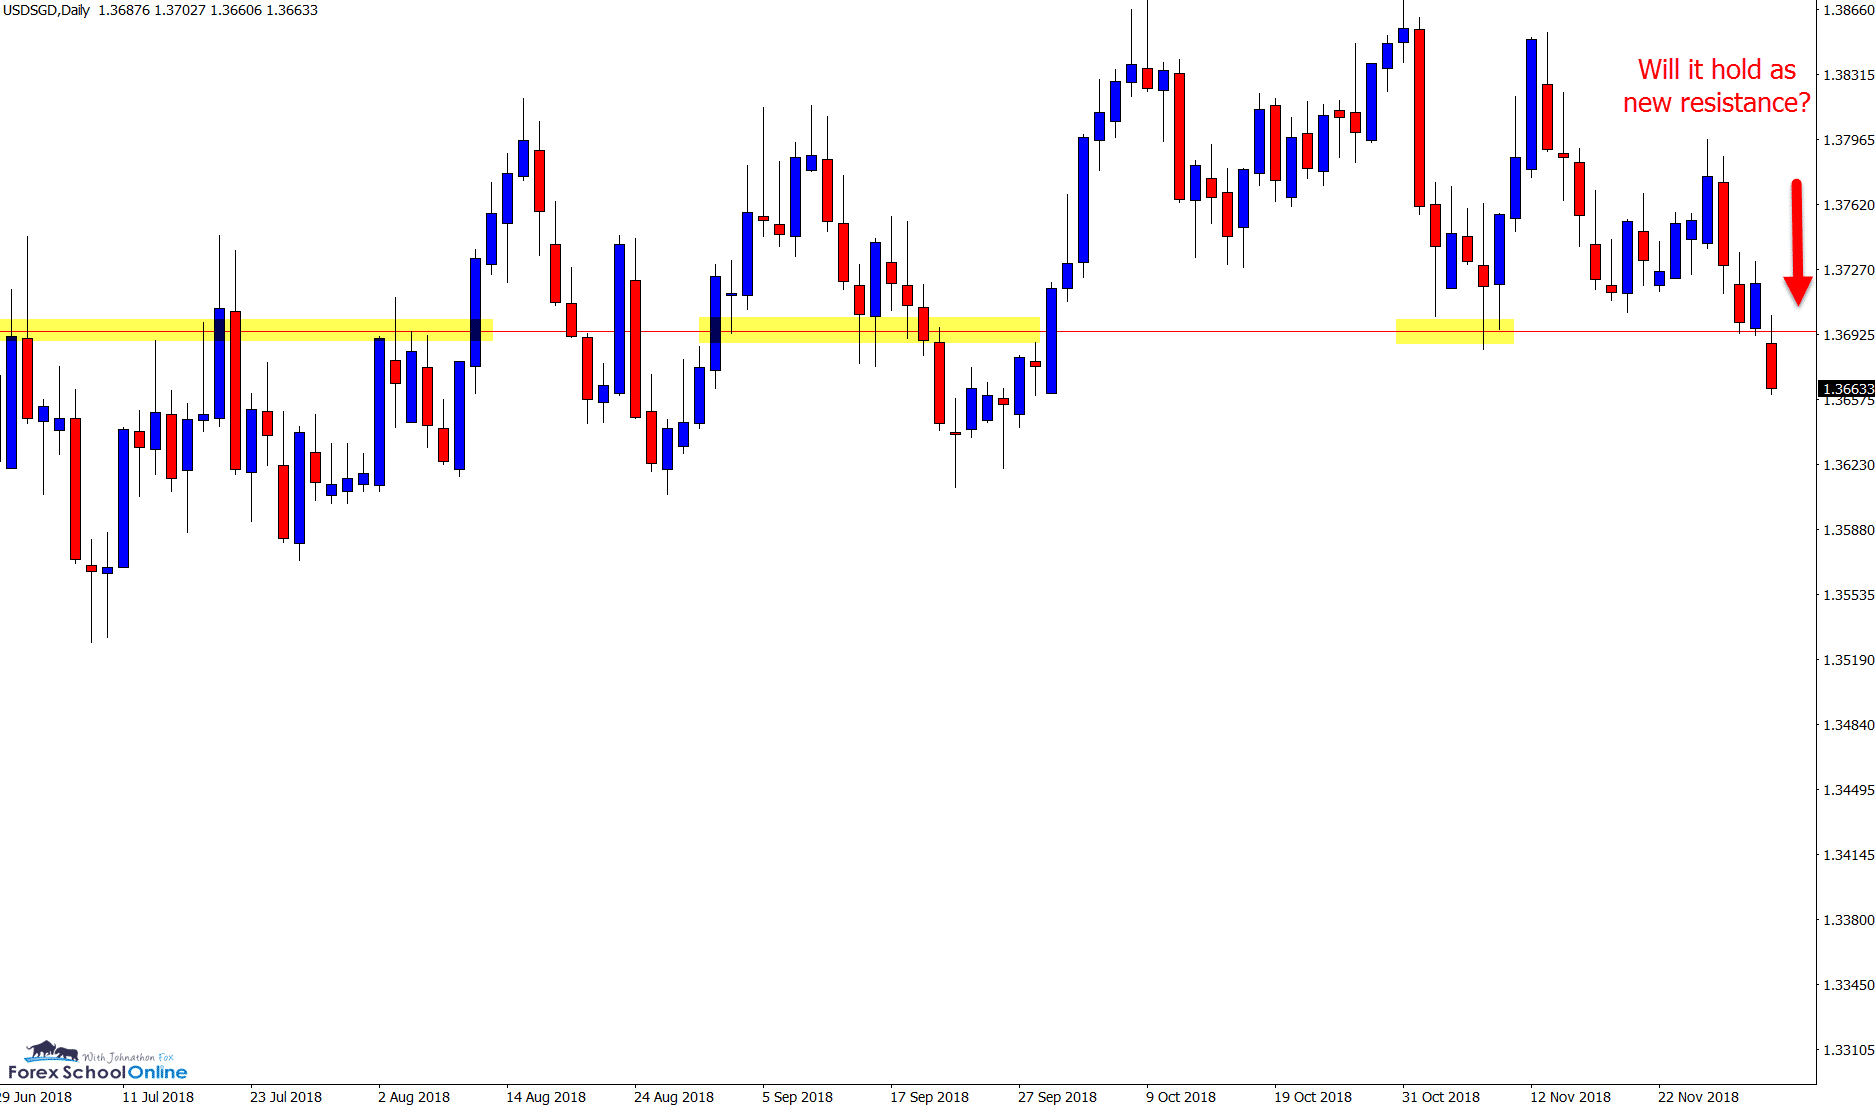
USDSGD Daily & 1 Hour Charts
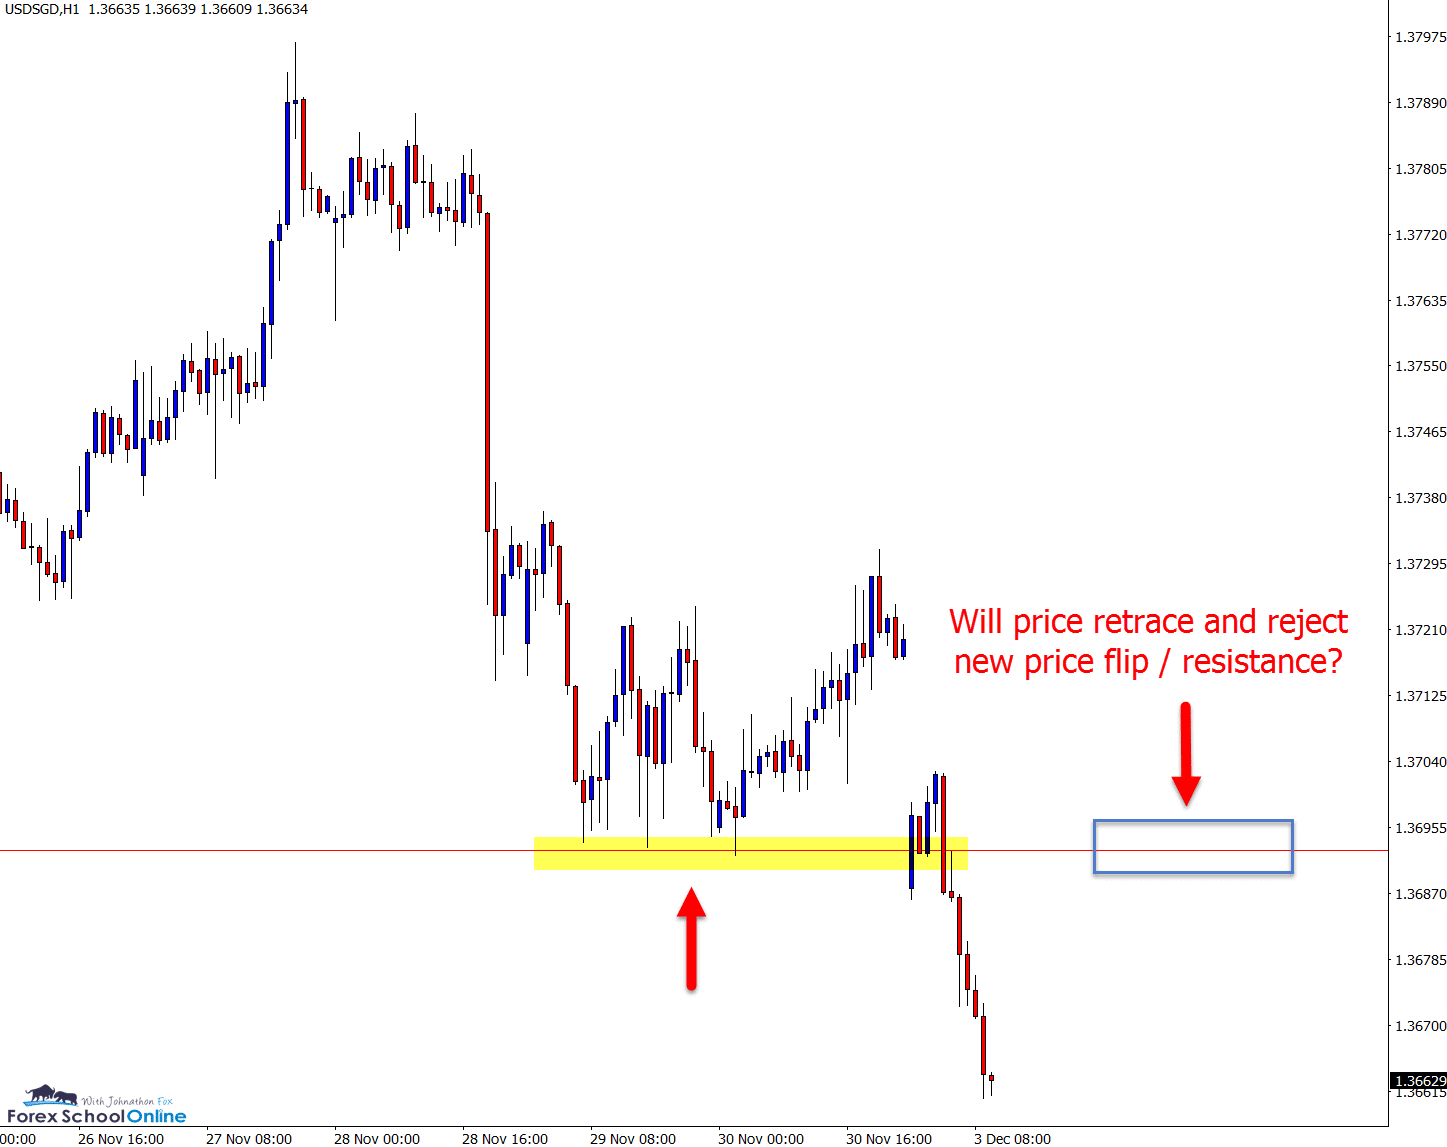
Possible Reversal & Price Flip on Intraday
For most of this year price has been slowly crawling higher in a slow up-trend in this market.
However; in recent times price has formed a topping formation with signs of looking to reverse.
We can see price has made lower highs and now lower lows on the daily price action chart. We can also see price repeatedly attempted and failed to continue the trend higher and form a new high.
Price has now snapped below a super interesting support level that will be a crucial level. The coming sessions will be a big watch on the daily and smaller time frames to see if this level can hold and fire off potential trade setups.
Daily Chart
1 Hour Chart
Note: We Use Correct ‘New York Close 5 Day Charts’ – Download Free New York Close Demo Charts Here
Charts in Focus Note: All views, discussions and posts in the ‘charts in focus’ are the view of Forex School Online and are not recommendations or trading advice. All posts are general in nature and are not advice to buy or sell.
Please leave questions or comments in the comments section below;


Leave a Reply