Weekly Price Action Trade Ideas – 31st Aug to 4th Sep 2020
Markets Discussed in This Week’s Trade Ideas: EURUSD, GBPUSD, AUDSGD, and GOLD.
Note: We Use Correct ‘New York Close 5 Day Charts’ – You can read about why we use these and how to download the correct free charts at Correct Free New York Close Demo Charts
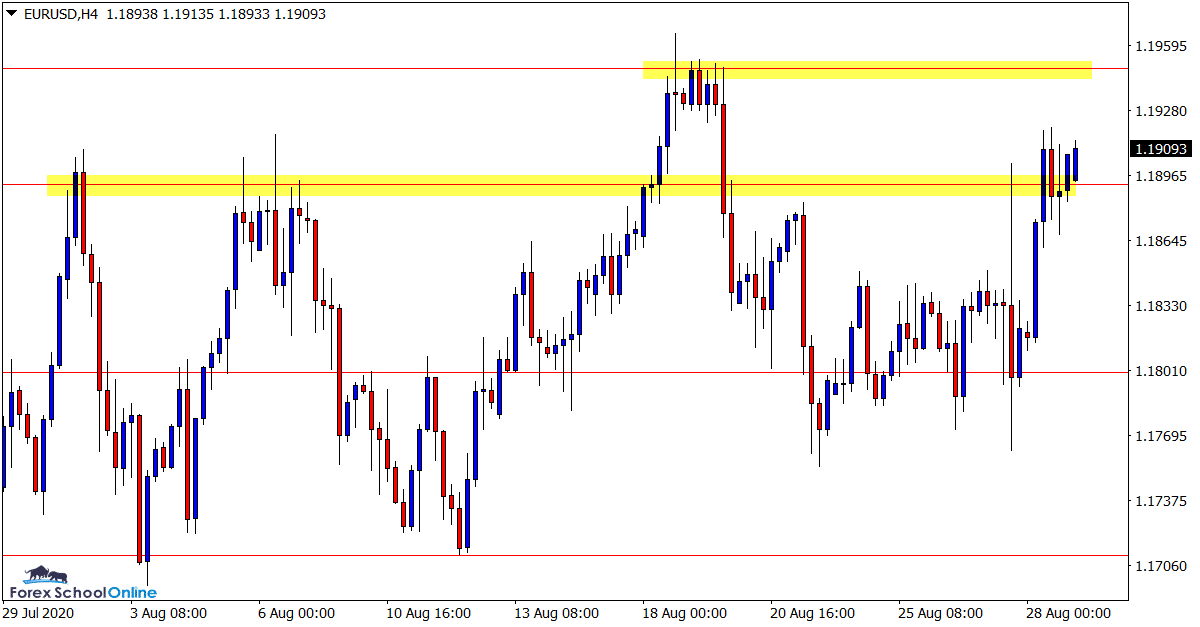
EURUSD 4 Hour Chart
Yearly Highs in Site
Price is now looking to breakout of the intraday resistance level with a potential re-test of the yearly highs made earlier in the month.
A test of these highs looks crucial because if the swing high resistance gives way we could see another extended leg higher.
The trend has been clearly higher on the daily chart this year and another break would expose a lot of free space for price to run higher into.
4 Hour Chart

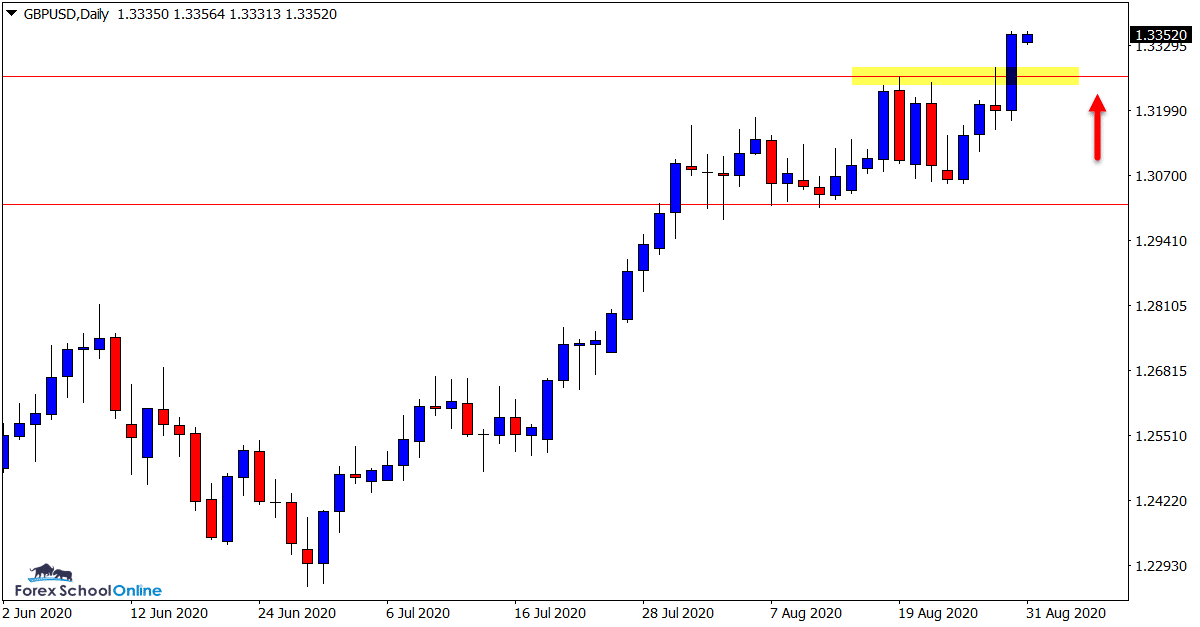
GBPUSD Daily Chart
Strong Push Higher Through Resistance
Price has finally snapped higher out of the consolidation box pattern it had been stuck in over the last three weeks.
The last time price tried to breakout it quickly reversed and created a false break.
The old breakout resistance level looks key.
For the breakout to remain a breakout and not a fakeout the old resistance will need to hold as a new support.
This could also be a solid level to watch for any bullish price action clues to get long.
Daily Chart

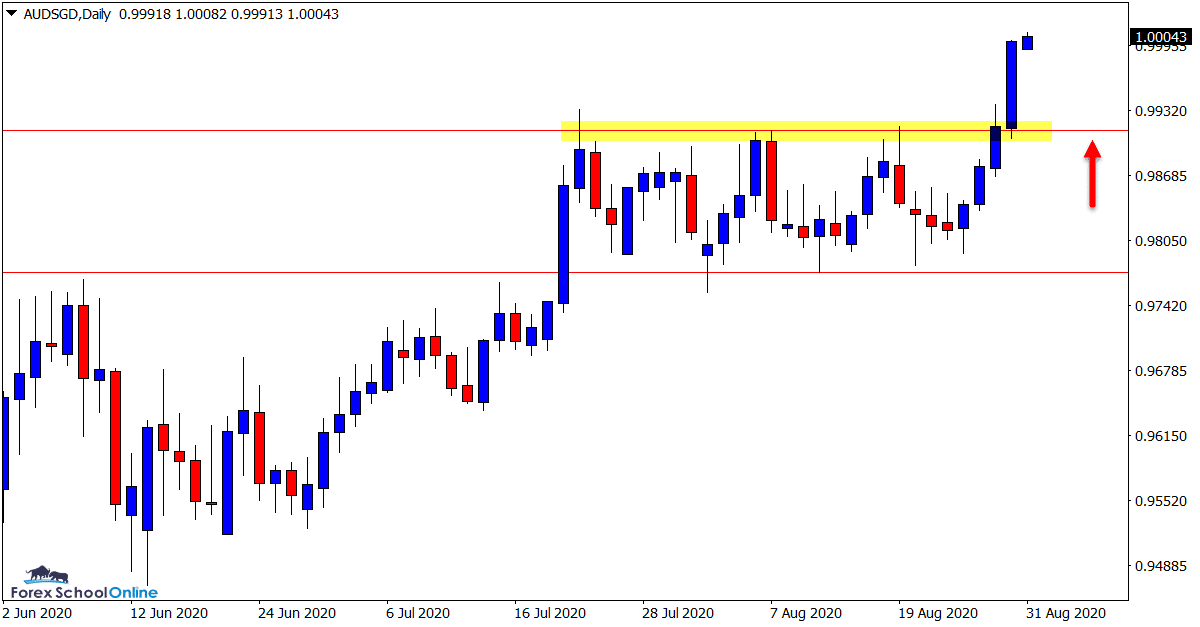
AUDSGD Daily Chart
Price Finally Breaks
We discussed this market in the weekly trade ideas last week and how price was strangled within a tight range and box pattern.
Price has finally broken out of this consolidation and exploded higher.
The breakout traders who made this trade would now be sitting on handy profits whilst others could be looking for a second chance entry.
If price rotates lower back into the old resistance it could look to act as a new price flip support level for long trades.
Daily Chart

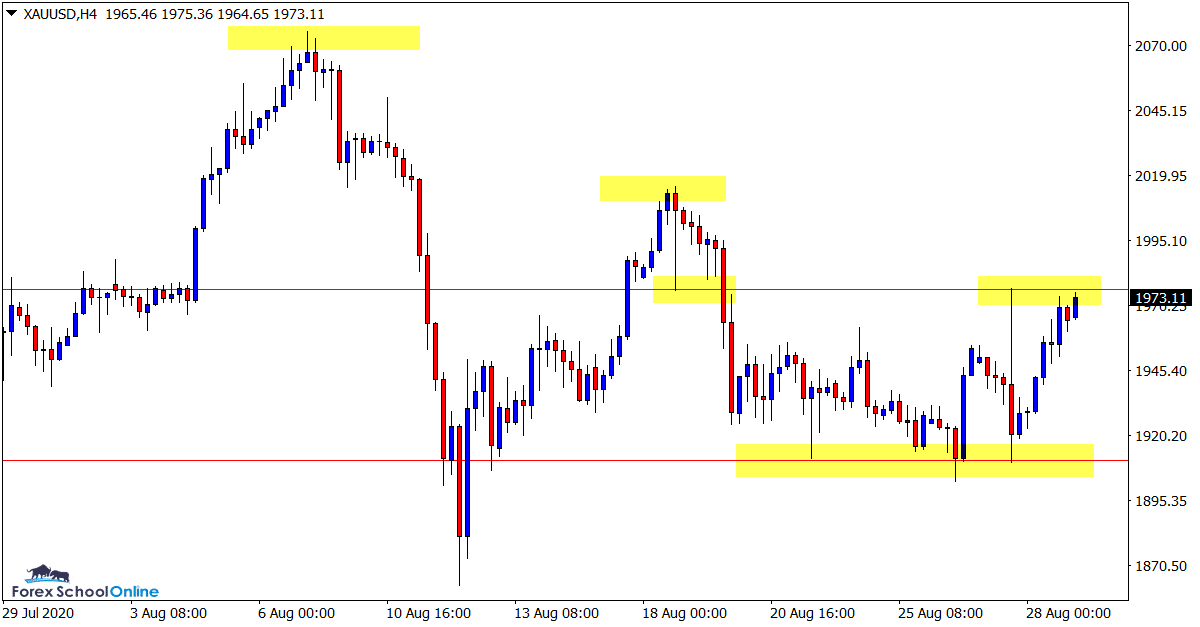
GOLD 4 Hour Chart
Can Price Continue This Week?
This is a market we have been charting and discussing heavily in recent times.
Whilst price has now moved through a period of sideways consolidation, it could be looking to make its next serious move.
As the attached 4 hour chart shows; price is testing an important intraday resistance level.
If this level gives way, price could quickly move back into the recent swing high before once again testing the major resistance level.
4 Hour Chart

Trade Ideas Note: All views, discussions and posts in the ‘charts in focus trade ideas’ are the view of Forex School Online and are not recommendations or trading advice. All posts are general in nature and are not advice to buy or sell.
Note: We Use Correct ‘New York Close 5 Day Charts’ – You can read about why we use these and how to download the correct free charts at Correct Free New York Close Demo Charts
Please leave questions or comments in the comments section below;


Leave a Reply