Weekly Price Action Trade Ideas – 2nd to 6th September 2019
Markets Discussed in This Week’s Trade Ideas: EURUSD, SILVER, AUDJPY and USDJPY.
Note: We Use Correct ‘New York Close 5 Day Charts’ – You can read about why we use these and how to download the correct free charts at Correct Free New York Close Demo Charts
EURUSD Daily Chart
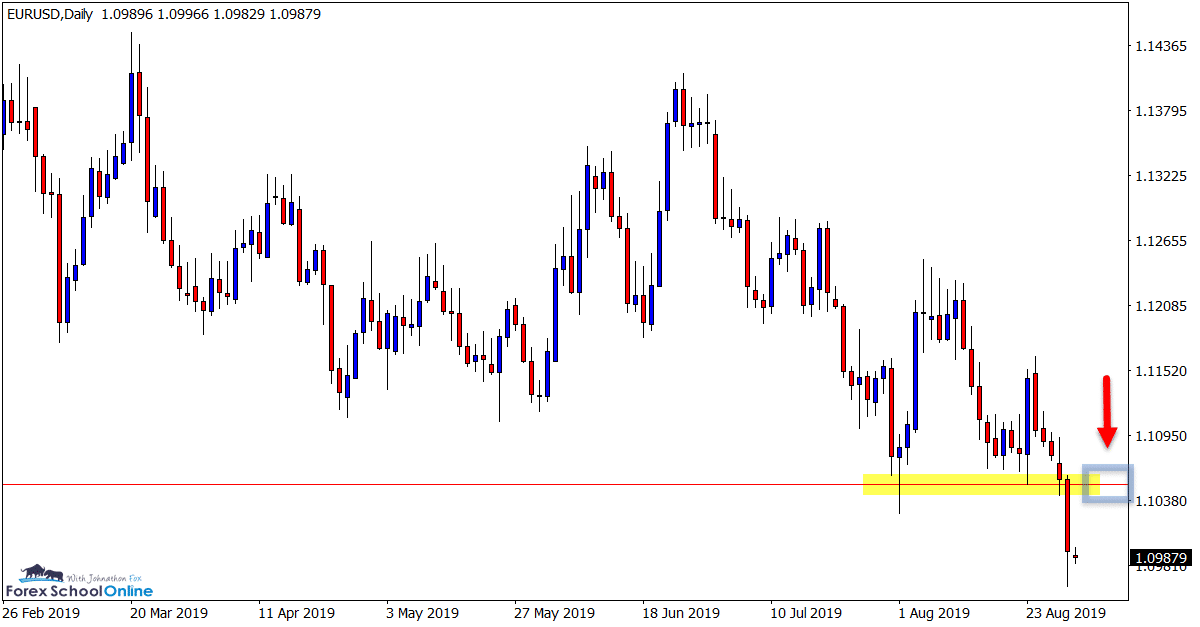
Price Finally Breaks Lower
Price action on the EURUSD daily chart has broken out lower aggressively through an important support level.
As discussed in the recent trade ideas on the 12th of August; price action on the EURUSD had been going nowhere and had just been chopping back and forth.
The sideways movement that was providing no follow through was making it hard to find any A+ trading opportunities without the risk of being whipsawed out.
This large and aggressive sell off could now pave the way for some more free flowing moves and also open the way for potential short trade setups.
Daily Chart
SILVER Daily and 8 Hour Charts
Price Roaring in Trend Higher
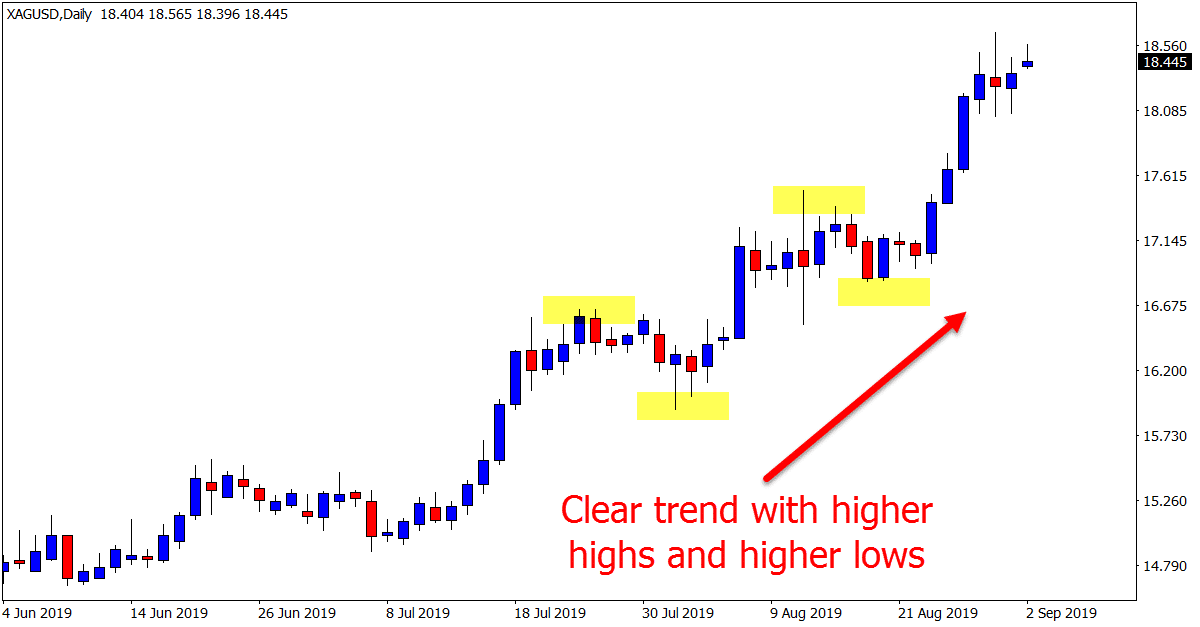
Price has been roaring higher on the daily chart of Silver in recent times in a clear trend with higher highs and higher lows.
As the daily chart shows below; whilst we have been seeing price pause and make short retracements, since May prices have been trading all one way.
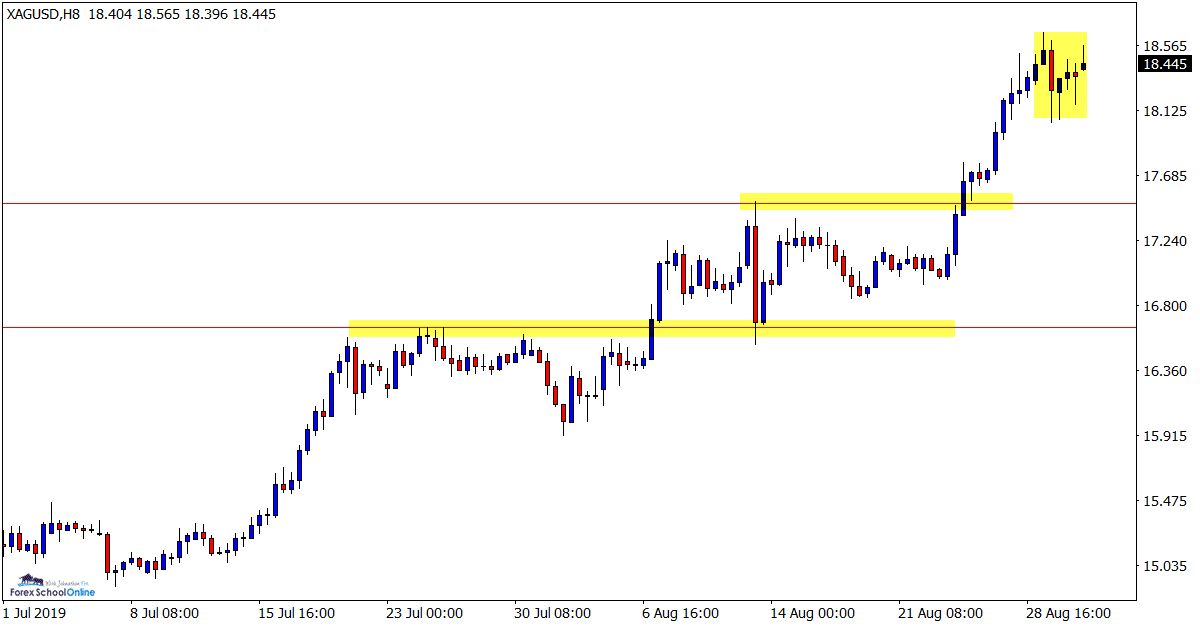
The 8 hour chart shows this move clearly and the small pause and consolidation that price is now moving through.
Until the trend bends, looking to trade with it looks the solid play, hunting for high probability trade setups on any short-term pullbacks lower.
Daily Chart
8 Hour Chart
NOTE: If you want to create 8 hour charts (or any time frame) like the Silver 8 hour chart above on your MT4 charts, get the free indicator at; Create Any Time Frames on MT4
USDJPY Daily and 4 Hour Charts
Price Caught in a Sideways Box
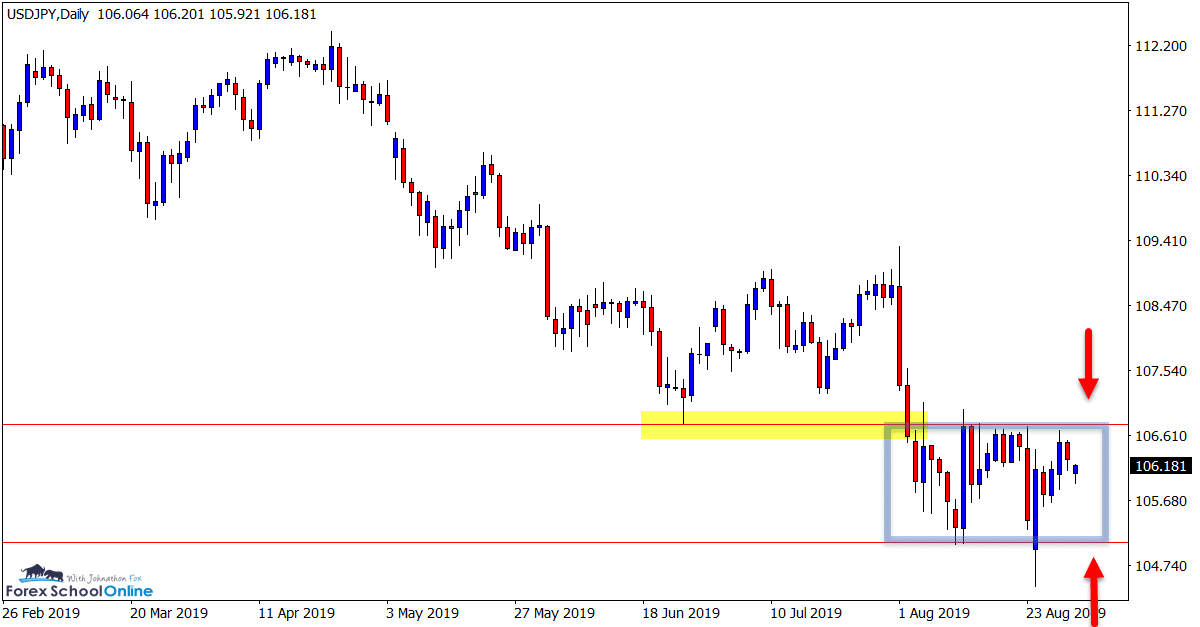
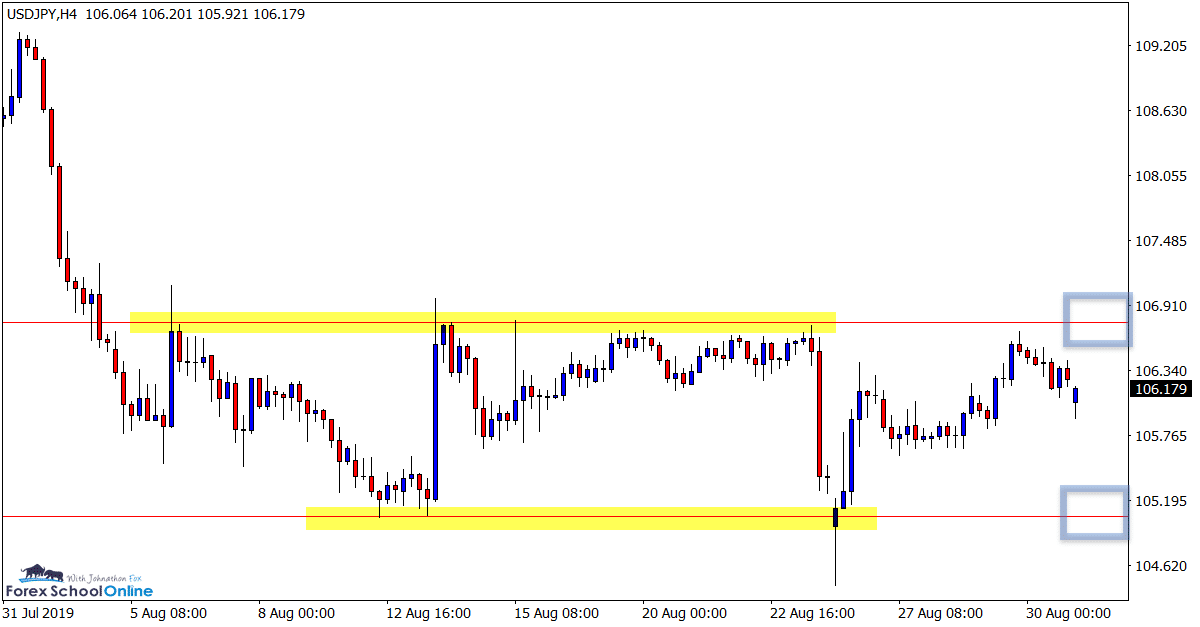
Price action on the USDJPY daily chart is stuck just at the moment in a sideways box.
Whilst the medium term move is lower, in the short-term price is caught in this consolidation and range period that could provide interesting watching, especially for aggressive traders.
As the 4 hour chart shows below; the high and the low of this box are fairly clear and until they give way and breakout, aggressive traders could look for price action clues to trade both long and short.
When we finally do get a break, it could be quick and aggressive and decide the new direction for the next decent move.
Daily Chart
4 Hour Chart
AUDJPY Daily Chart
Inside Bars Sitting on Support
In last week’s trade ideas we discussed this market and the potential false break price was creating on the intraday charts.
As we highlighted in those trade ideas; the false break was running back into a bunch of ‘trouble areas’ and smaller resistance that looked to be potential problems for price making any decent moves.
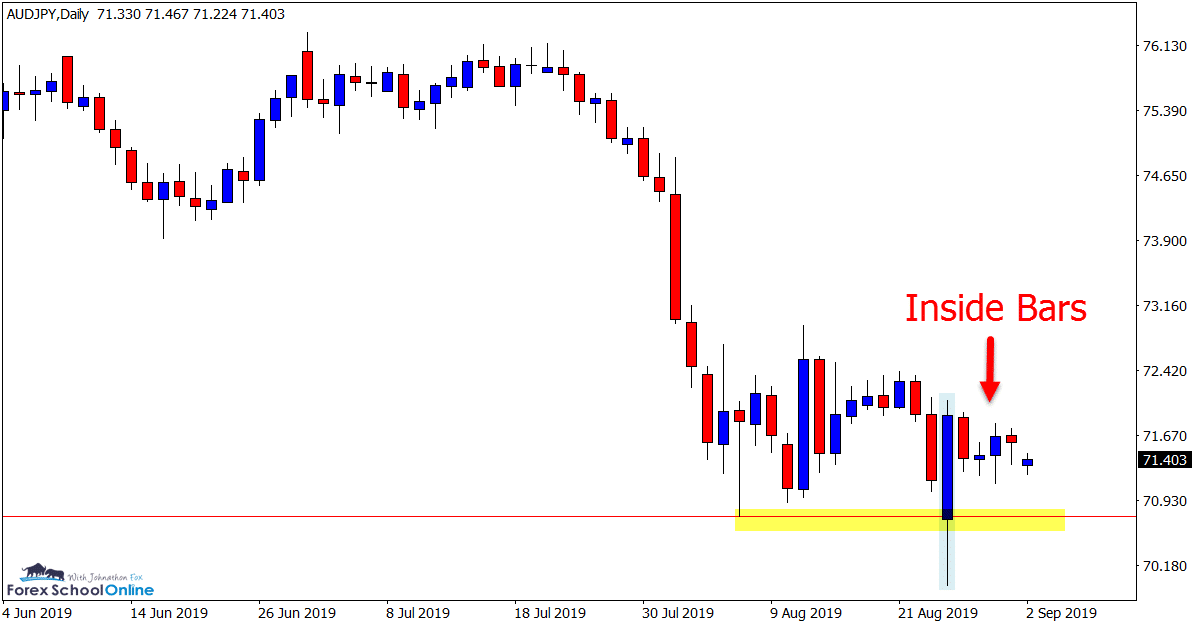
Price has once again stalled on the daily chart, forming a series of inside bars and is sitting on the major daily support level.
This level looks to be key. If we can get a solid break below, through the support and also the inside bars, it could pave the way for potential short trade setups.
Daily Chart
Trade Ideas Note: All views, discussions and posts in the ‘charts in focus’ are the view of Forex School Online and are not recommendations or trading advice. All posts are general in nature and are not advice to buy or sell.
Please leave questions or comments in the comments section below;


Good calls.
Thanks 👍
That’s very perfect.
Thanks a lot.
👍👍