Weekly Price Action Trade Ideas – 2nd to 6th Nov 2020
Markets Discussed in This Week’s Trade Ideas: AUDNZD, USDCAD, EURAUD and US500.
Note: We Use Correct ‘New York Close 5 Day Charts’ – You can read about why we use these and how to download the correct free charts at Correct Free New York Close Demo Charts
AUDNZD Daily Chart
-
Watching for Pullback Into Resistance
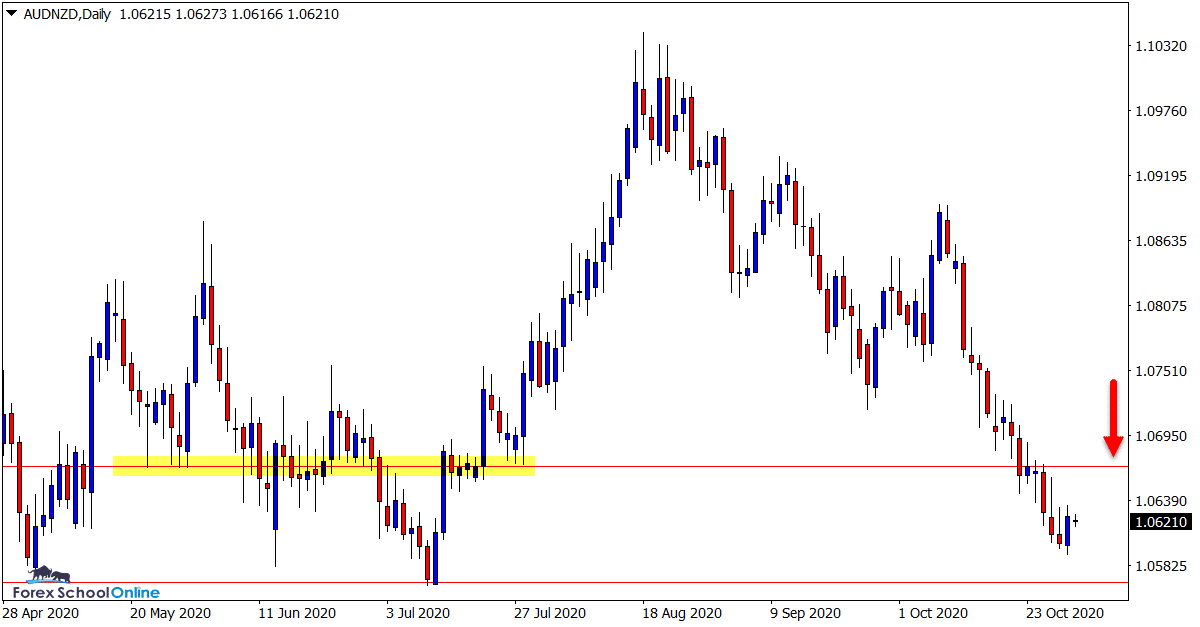
Price on the AUDNZD has been in a steady trend for the past three months now.
As the daily chart shows; price has been making a series of lower lows and lower highs backed with some strong momentum.
Looking to trade inline with this momentum with short trades looks the best play whilst the trend lower holds.
If price can now rotate back higher into the overhead resistance it could provide a potential area to start hunting short trades on the daily and intraday time frames.
Daily Chart

USDCAD Daily Chart
-
Watching Both Sides of the Market
We have been discussing this market quite a bit in recent times.
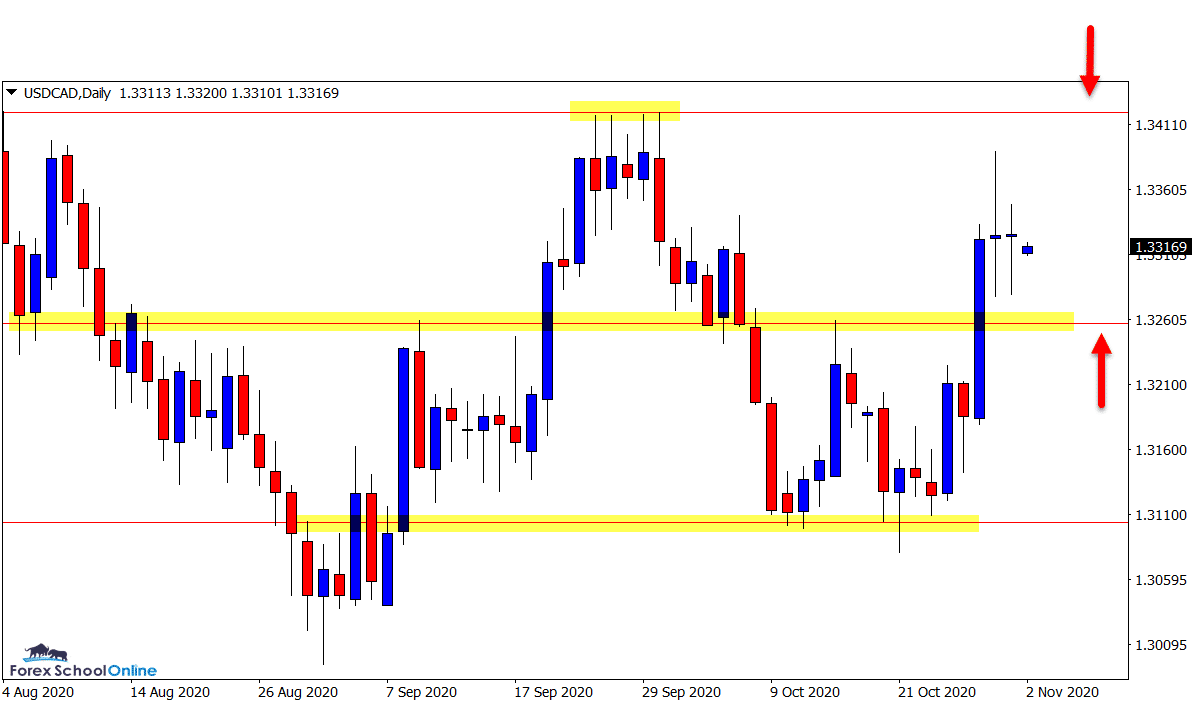
Whilst price action is in a fairly clear-cut range and sideways pattern, there are still some solid levels to look for trading opportunities.
Price has now moved above the mid-way point of the range and is looking to move into the highs.
As the daily chart shows; price formed an inside bar just above the price flip support level.
If this level holds we could look for a test of the resistance level for new potential short trades.
Daily Chart

EURAUD Daily Chart
-
Can Support Hold for Next Leg Higher?
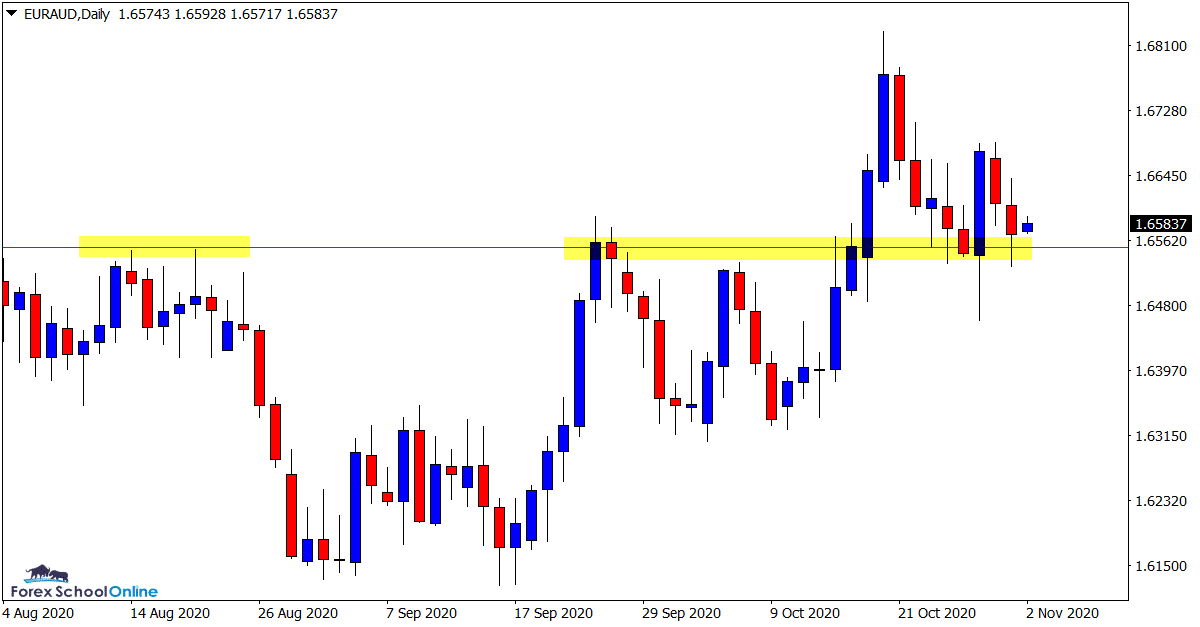
The VIP group recently played a long breakout trade in this pair as price broke out of the extended range that price action had been trading within.
The follow up momentum has so far been lacking and we have not seen the explosion higher we may have expected.
Price has now returned to the old breakout resistance level and formed a bullish engulfing bar.
If this level holds as a new price flip support and price moves beyond the highs of the engulfing bar it could set up and trigger long trades with the next extended leg higher to follow.
Daily Chart

Us500 Daily Chart
-
Key Daily Support Now Being Tested
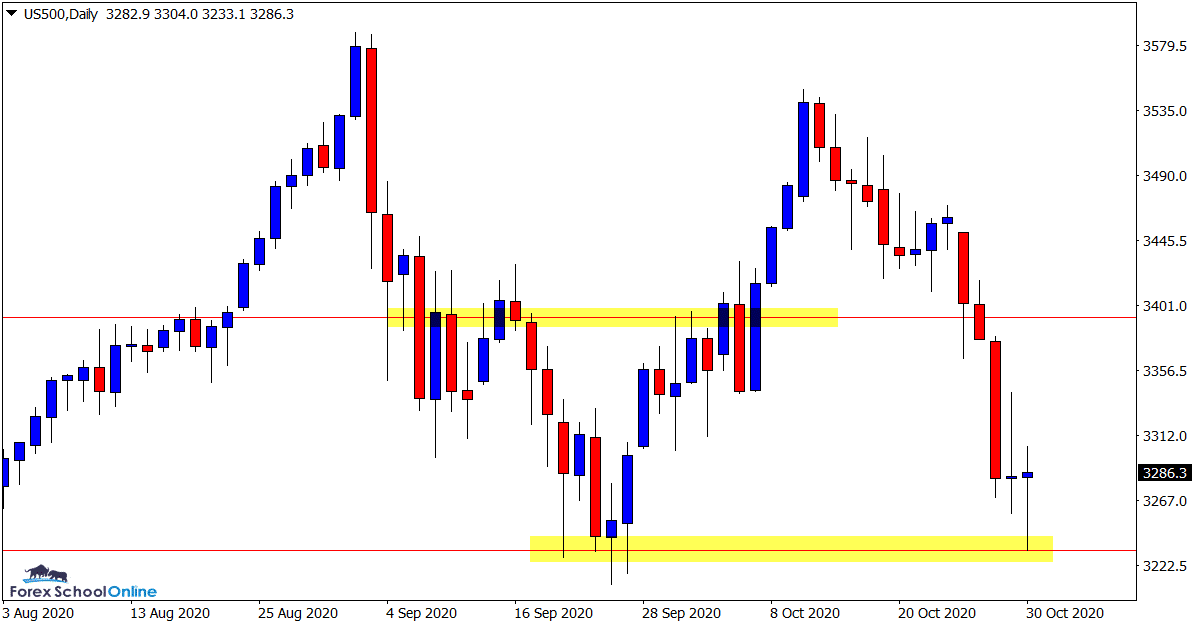
After forming such a recovery and strong trend higher in recent times, price has now cooled off and sold away from the extreme highs.
Price has now moved back to be testing what looks to be a crucial support level for this market.
In recent times we have seen price attempt to make a new high, but in the process form a lower high and now sell off lower.
If this support gives way it would signal a short term trend lower and the support level could turn to a price flip resistance.
Keep in mind with this market there are some rather large events happening in the US this week that will have the ability to push and pull the markets without a moments notice.
Daily Chart

Trade Ideas Note: All views, discussions and posts in the ‘charts in focus trade ideas’ are the view of Forex School Online and are not recommendations or trading advice. All posts are general in nature and are not advice to buy or sell.
Note: We Use Correct ‘New York Close 5 Day Charts’ – You can read about why we use these and how to download the correct free charts at Correct Free New York Close Demo Charts
Please leave questions or comments in the comments section below;


Leave a Reply