Weekly Price Action Trade Ideas – 29th June to 3rd July 2020
Markets Discussed in This Week’s Trade Ideas: EURGBP, AUDCAD, GBPCHF and GOLD.
Note: We Use Correct ‘New York Close 5 Day Charts’ – You can read about why we use these and how to download the correct free charts at Correct Free New York Close Demo Charts
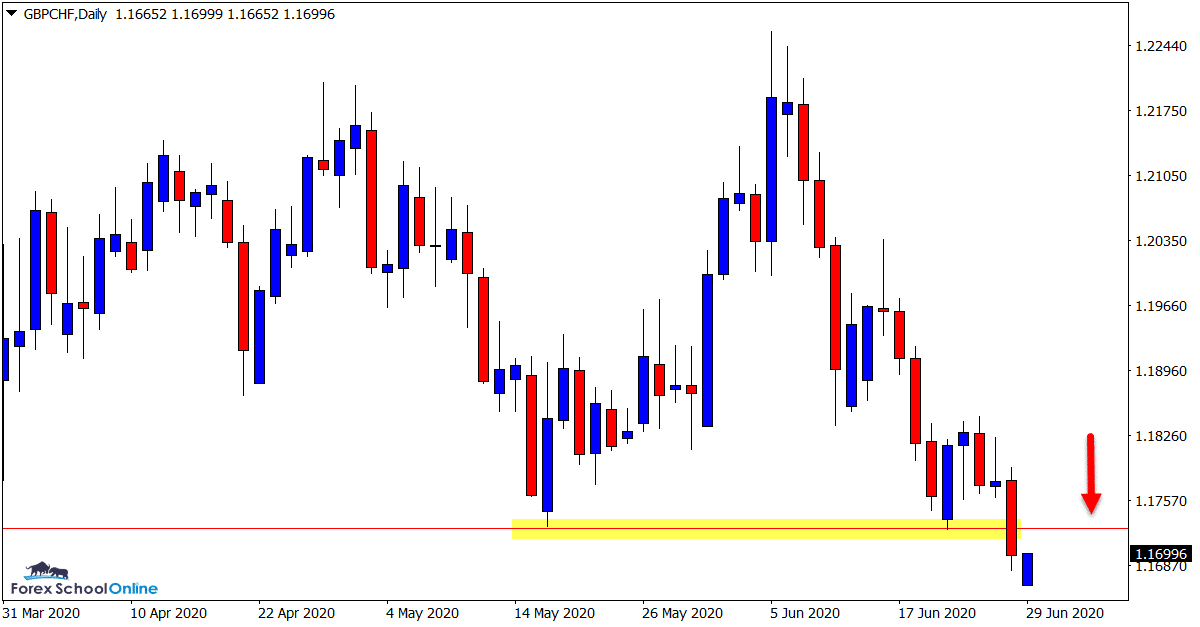
GBPCHF Daily Chart
Breakout or False Break?
This is an interesting market.
Whilst in the medium term price is in a range, the short-term sees price moving lower.
Price action on the daily chart last week saw price move lower to break the recent support level and that level looks key in the next few sessions.
If this level holds as a new resistance it could open the door for potential short trading opportunities on the daily and intraday charts.
Daily Chart
EURGBP Daily Chart
Will Breakout Continue Push Higher?
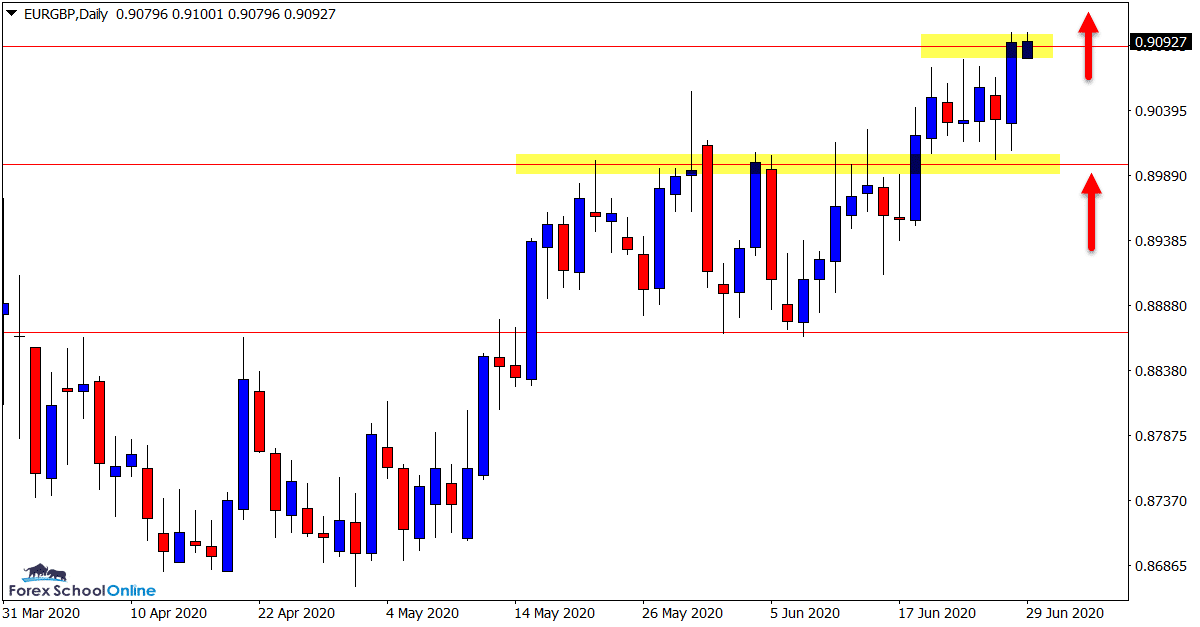
In last week’s trade ideas we were watching this pair to see if the old breakout resistance area could hold as a new support for the next leg higher.
Whilst the price flip has held as a support level, price has not been able as yet to make a sustained push higher.
Price is now testing the immediate resistance level.
If this gives way it could pave the way for a strong leg higher and some solid long trading opportunities.
Daily Chart
AUDCAD Daily Chart
Watching for Breakout
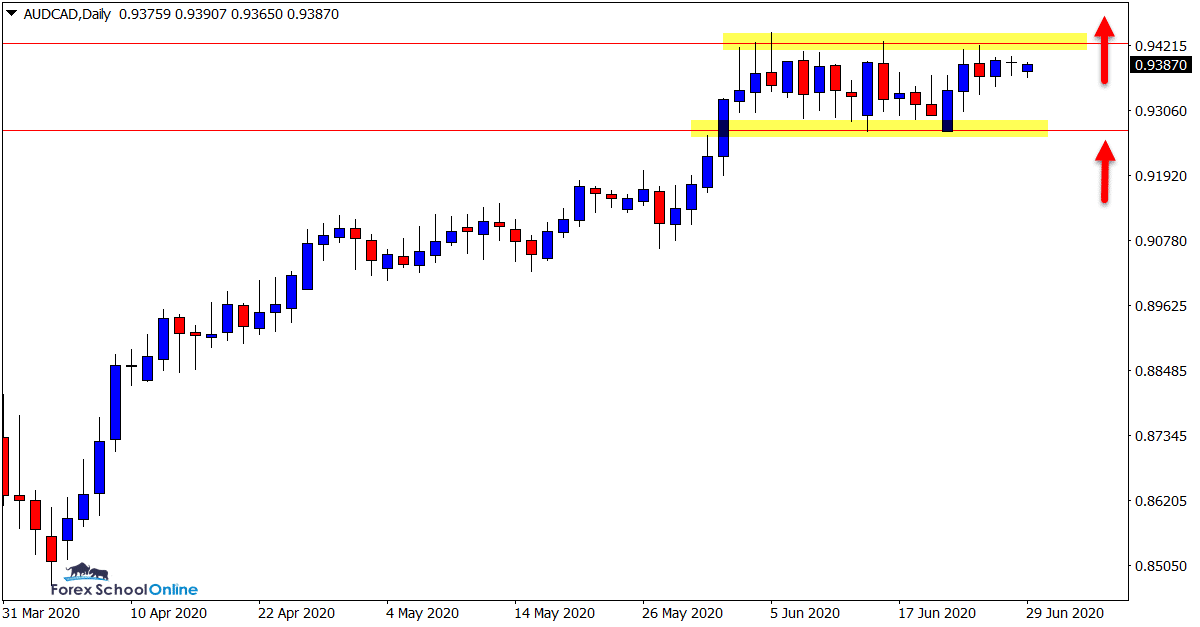
Similar to a lot of Aussie pairs, this pair has made a huge rebound higher before making a sideways move in more recent times.
As the daily chart shows below; in recent sessions price has consolidated and moved into a box pattern.
If we can see this box breakout inline with the previous momentum higher it could see the next leg higher continue.
This could also pave the way for potential breakout and breakout and re-test trades.
Daily Chart
GOLD Daily and 1 Hour Charts
Multi-Year Resistance Coming Into Play
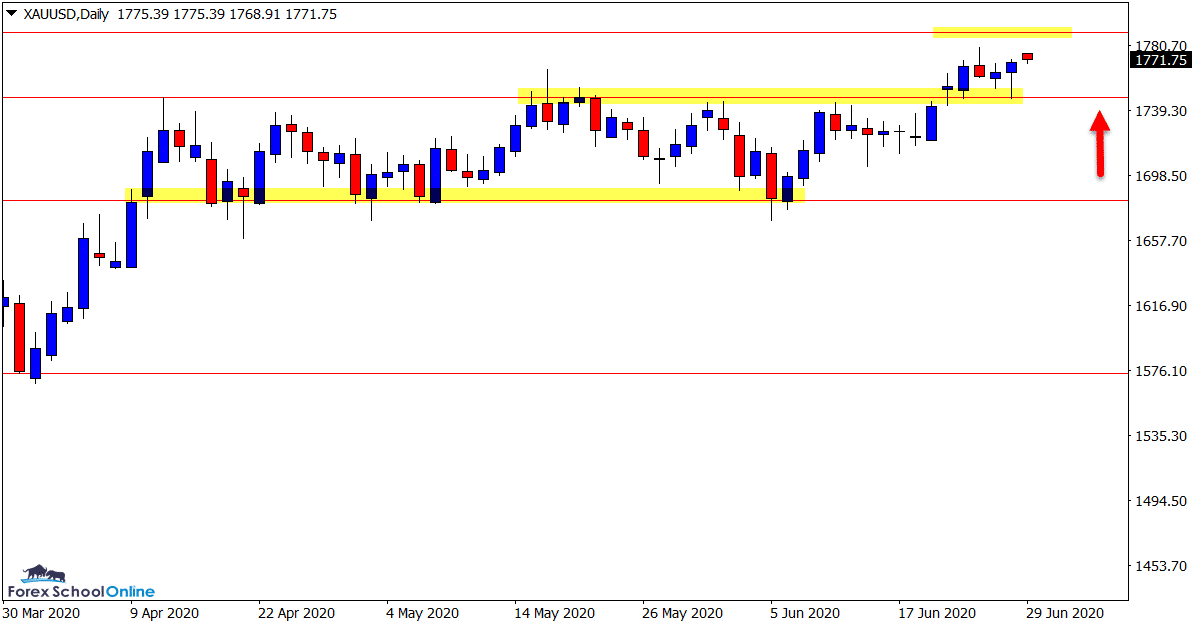
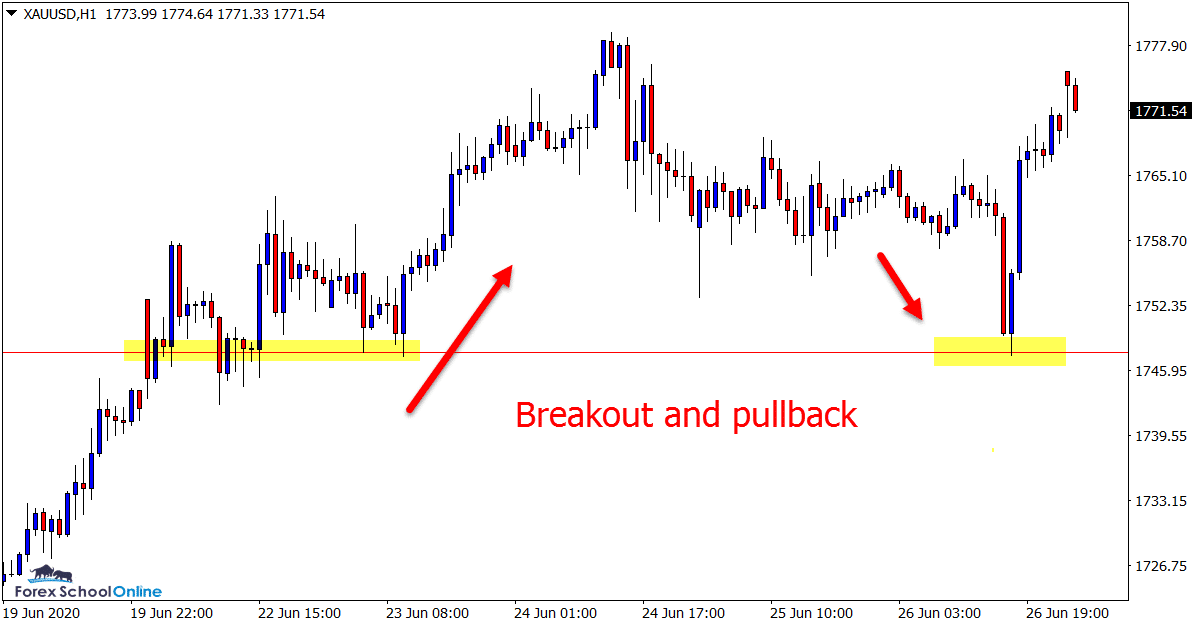
In last week’s trade ideas we were looking for price to finally breakout higher in this market.
Whilst price did make the breakout through the resistance level, there was not the explosion that some may have expected.
After the breakout price made a quick rotation back lower where the breakout resistance held as a new support level. See the 1 hour chart below.
If this level now holds we could see price make a move higher into a resistance not tested since 2012 before a potential move much higher.
Daily Chart
1 Hour Chart
Trade Ideas Note: All views, discussions and posts in the ‘charts in focus trade ideas’ are the view of Forex School Online and are not recommendations or trading advice. All posts are general in nature and are not advice to buy or sell.
Note: We Use Correct ‘New York Close 5 Day Charts’ – You can read about why we use these and how to download the correct free charts at Correct Free New York Close Demo Charts
Please leave questions or comments in the comments section below;


Leave a Reply