Weekly Price Action Trade Ideas – 29th April to 3rd May
Markets Discussed in This Week’s Trade Ideas: AUDUSD, GBPJPY, NZDJPY and OIL v USD.
Note: We Use Correct ‘New York Close 5 Day Charts’ – You can read about why we use these and how to download the correct free charts at Correct Free New York Close Demo Charts
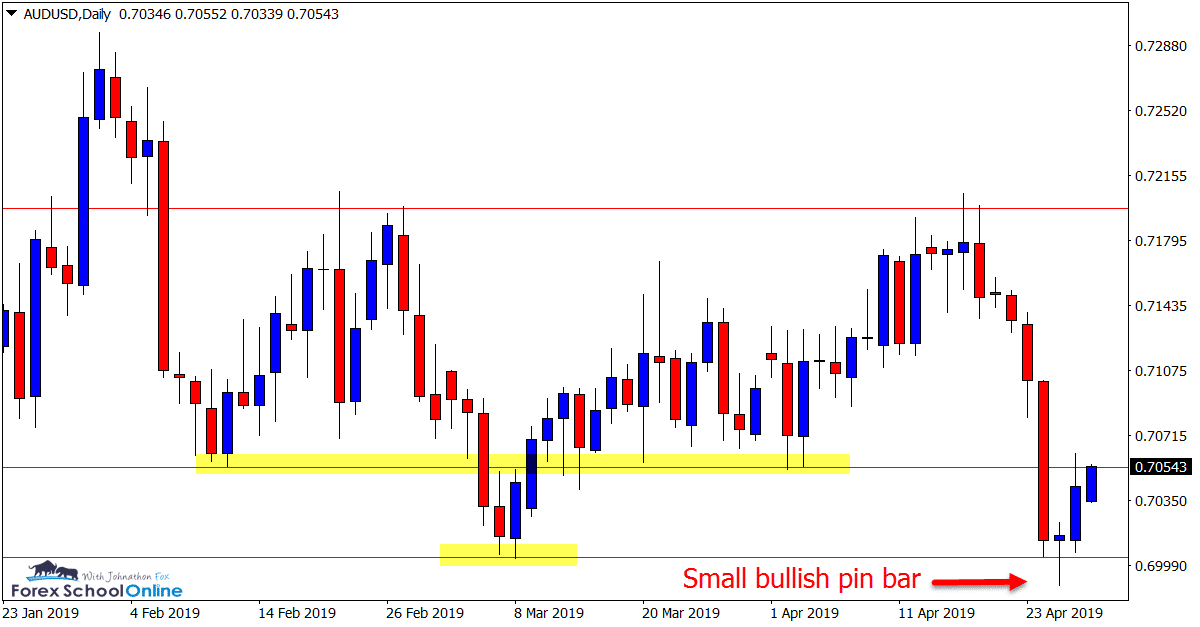
AUDUSD Daily Chart
Small Bullish Pin Bar
The daily price action chart of the Aussie rejected the highs of the range yet again to fall back and into the range.
In last week’s trade ideas we discussed this market and how we were looking at playing it. We can see that after moving lower price did breakthrough one of the range support levels only to be stopped in its tracks at the major support.
Price fired off a small bullish pin bar rejecting the low of the range and has since bounced back higher and right back into the chop. Price is now testing the resistance that it just broke out of, but if it does move back into the middle of the range there would be no change to how we look to play this market.
Daily Chart
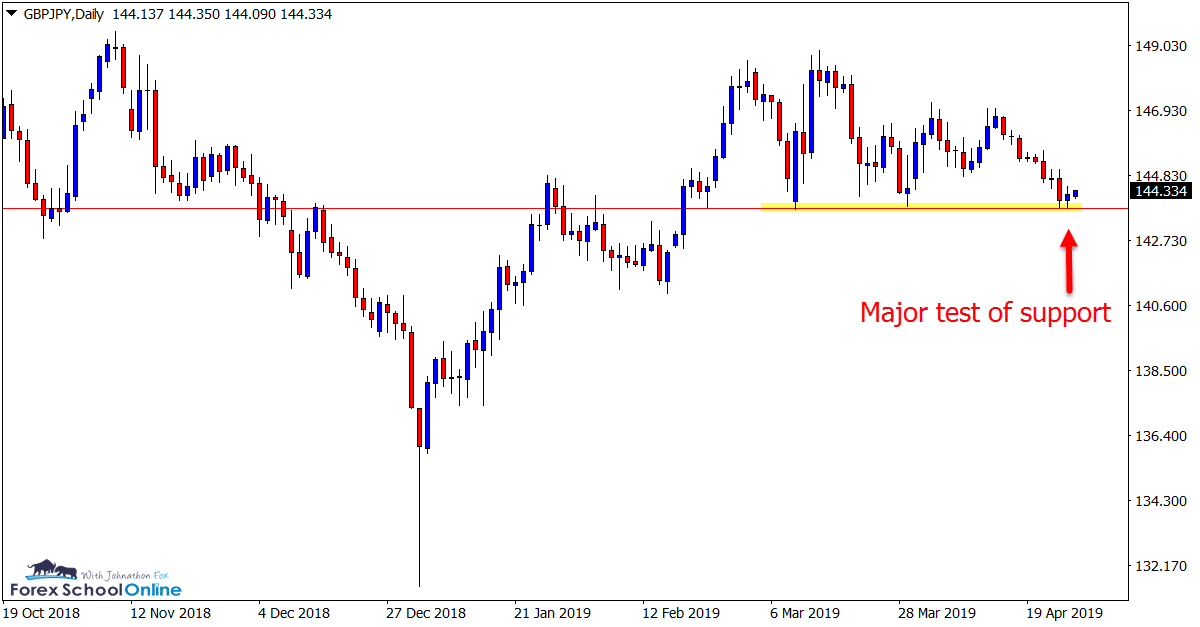
GBPJPY Daily Chart
Big Test of Daily Support
In recent weeks price on the daily chart of this pair has been forming lower highs and repeatedly testing the major support level.
That is where we find price once again with a very interesting test coming up in the next few sessions. This level looks to be crucial for where price makes its next major move.
An aggressive break lower could pave the way for a lot of trading opportunities to open up including quick breakout setups and breakout and re-test trades.
Daily Chart
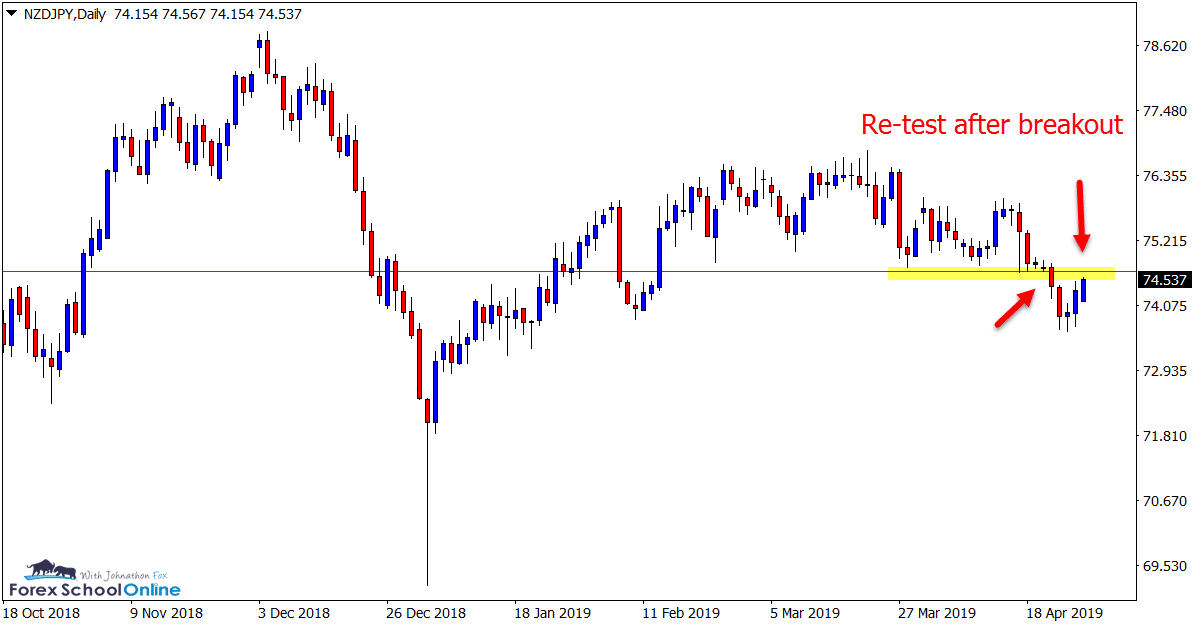
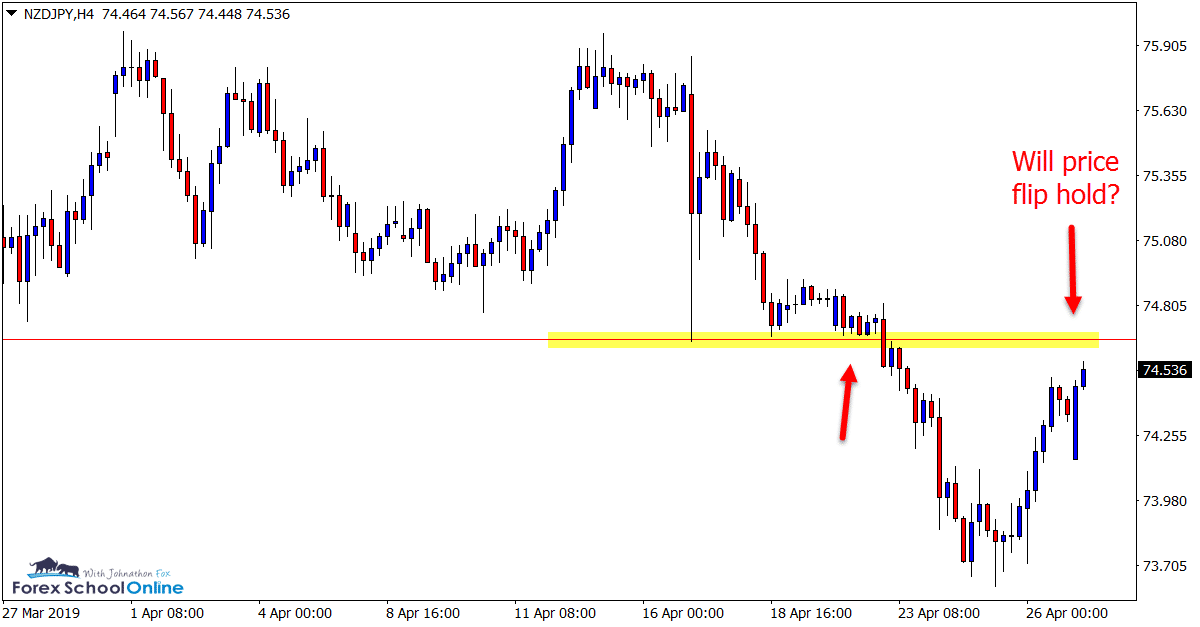
NZDJPY Daily and 4 Hour Charts
Re-test of Breakout Level
We have been discussing and posting about this market a little bit of late as price had been stuck moving sideways, but always looking to potentially break the daily support level.
After forming the inside bar we discussed in last week’s trade ideas, price did breakout lower with a fast and aggressive move. You will also note that just before this breakout lower price consolidated and formed back-to-back inside bars on the 4 hour chart.
Since this breakout price has quickly retraced and is now looking to re-test the same level. This will be a super interesting level to watch and see if it can hold as a new price flip resistance / old support level to continue a new move lower.
Daily Chart
4 Hour Chart
OIL v USD Daily and 4 Hour Charts
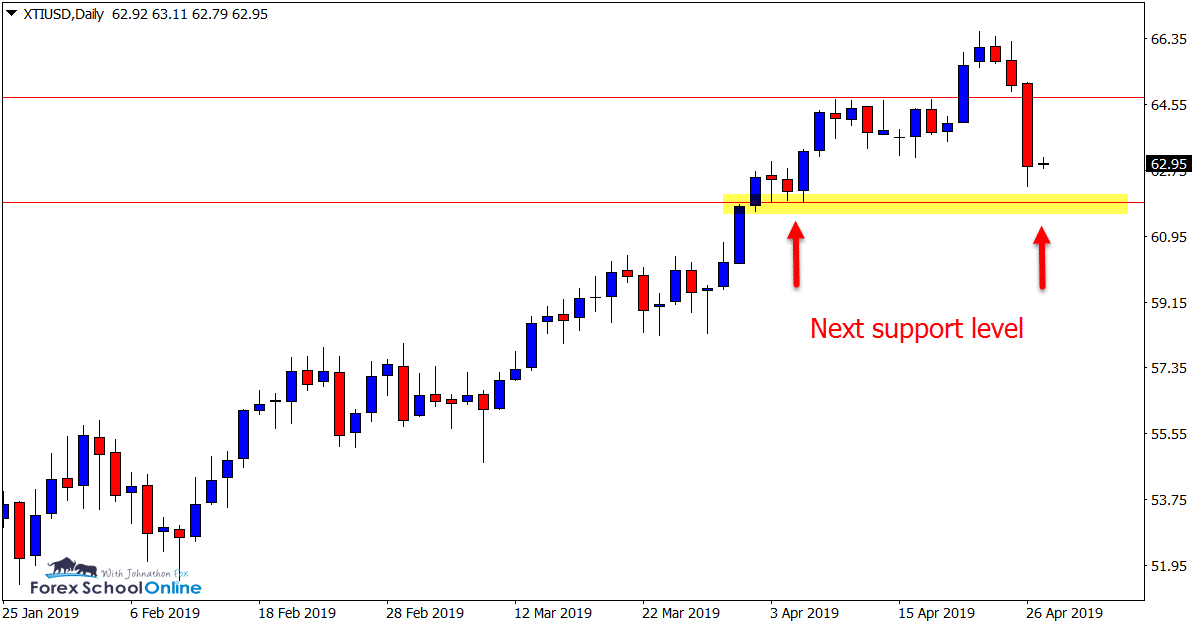
Next Support Crucial
This market has been in a roaring move higher in recent times with price forming a series of higher highs and higher lows.
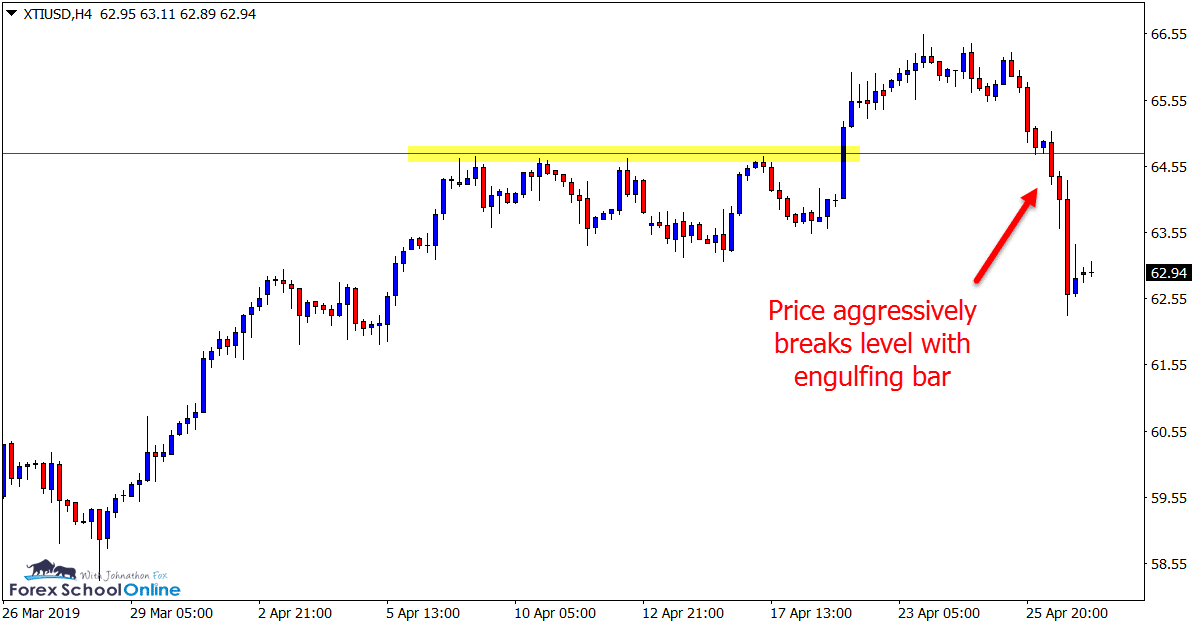
Whilst still at this stage in a move higher, price has broken a solid support level and made a strong move to the downside. For this move higher to continue and the trend to resume we would need to see the next support hold and the recent highs not act as a new price flip resistance.
Bullish traders could watch this daily chart support to look for signs of price resuming the move back higher with high probability bullish trade triggers.
Daily Chart
4 Hour Chart
Charts in Focus Note: All views, discussions and posts in the ‘charts in focus’ are the view of Forex School Online and are not recommendations or trading advice. All posts are general in nature and are not advice to buy or sell.
Please leave questions or comments in the comments section below;


Leave a Reply