Weekly Price Action Trade Ideas – 28th Sep to 2nd Oct 2020
Markets Discussed in This Week’s Trade Ideas: Markets Discussed in This Week’s Trade Ideas: USDCAD, NZDJPY, EURGBP and US500.
Note: We Use Correct ‘New York Close 5 Day Charts’ – You can read about why we use these and how to download the correct free charts at Correct Free New York Close Demo Charts
USDCAD Daily Chart
-
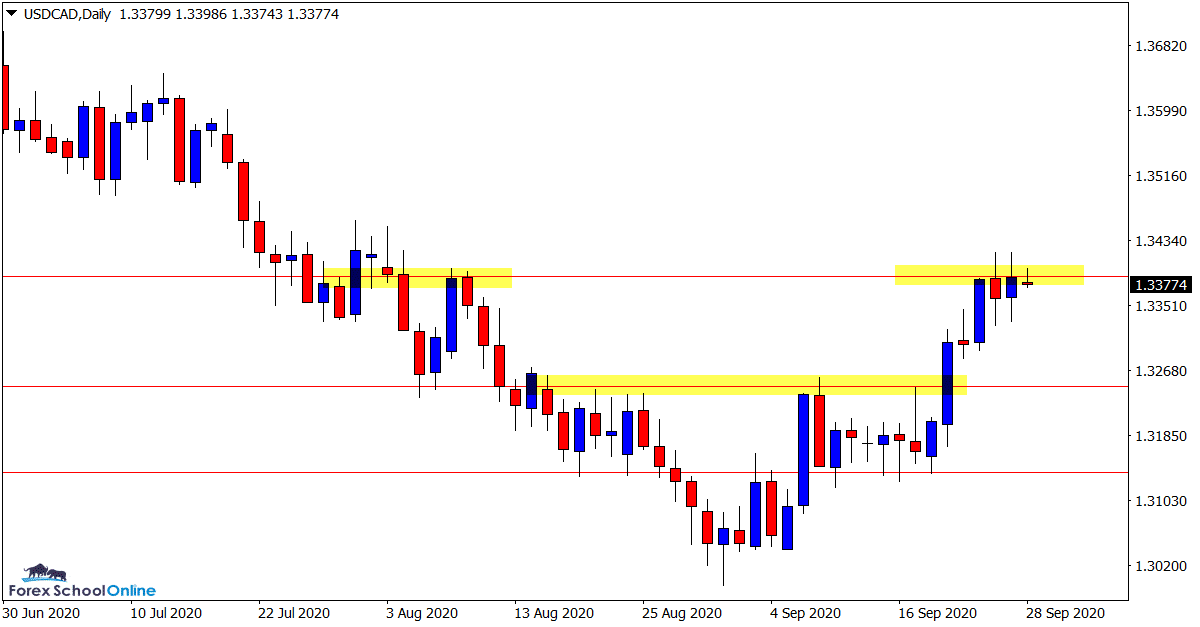
Will Price Now Pullack for the Bulls?
After breaking out of the tight range that price had been forming on the daily chart, price quickly rocketed higher.
Price is now sitting just underneath the daily resistance that last saw price make a serious sell off.
If this level holds, it could send price back lower and into the old breakout resistance level. That level could be a high probability level to look for long trades on the intraday and daily charts.
Daily Chart

US500 Daily Chart
-
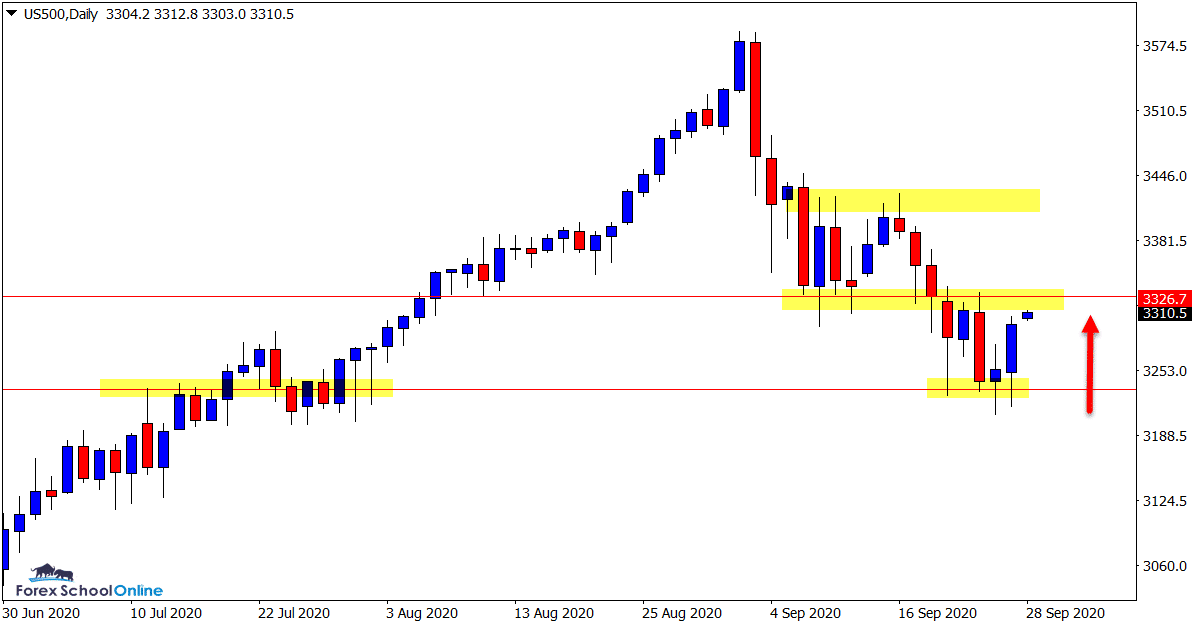
Support Holding for Run Into Resistance
We discussed this market last week and the crucial support level that price was testing on the daily chart.
This level has held with two bullish rejection candles and price is now looking to make a test of the near term resistance.
As the daily chart shows; this resistance has recently held as a solid support level.
For the uptrend to regain it’s momentum, this level will need to be broken. Until that happens, we continue to watch the price action unfold.
Daily Chart

NZDJPY Daily Chart
-
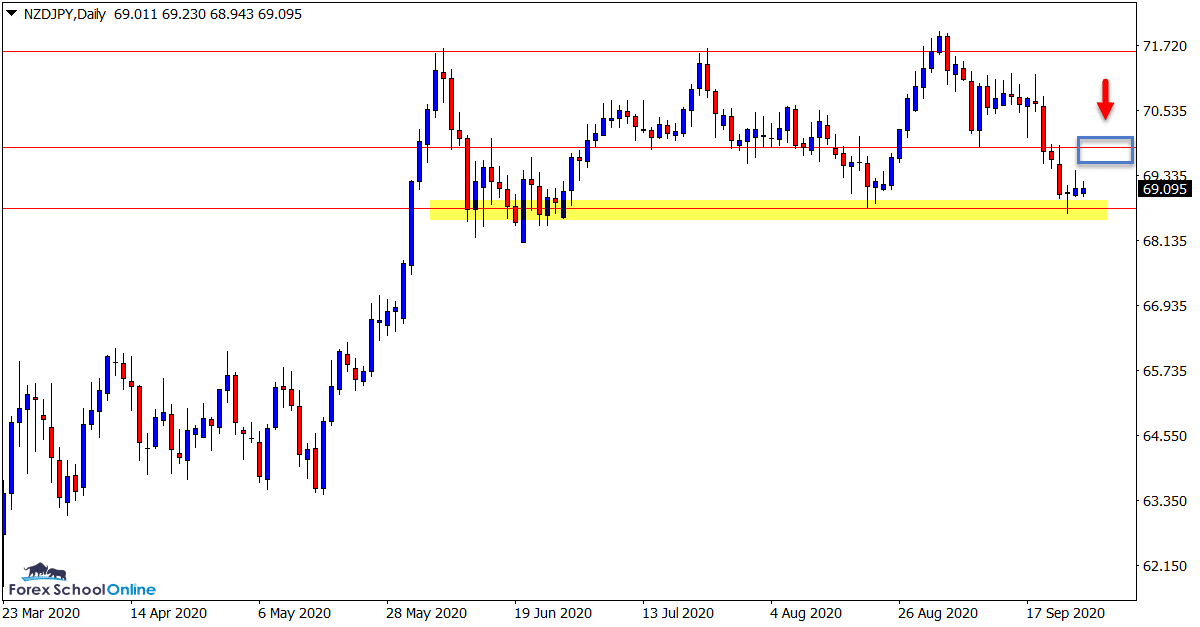
Looking for Intraday Short Trades
Similar to the USDCAD (but inverse), after breaking out of the tight daily chart range support area, price quickly moved into the next key support level.
The old breakout support level looks a solid level to act as a price flip resistance.
If price can find it’s way back into this price flip resistance, then it could provide some A+ short trading opportunities inline with the breakout momentum and at a key level. This market looks a key watch over the coming sessions.
Daily Chart

EURGBP 4 Hour Chart
-
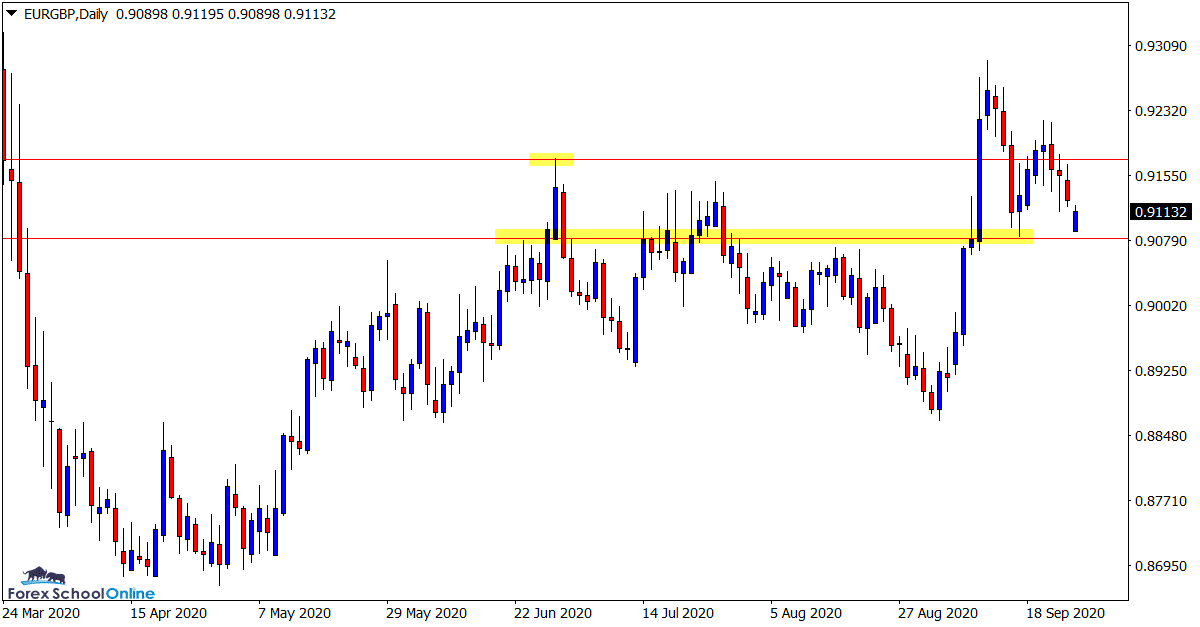
Potential 1,2,3 Reversal Pattern in Play
Price on this pair is in the last stages of attempting to form a 1,2,3 reversal pattern.
You can read about what exactly the 1,2,3 reversal pattern is here.
After forming the lower high, price is now looking to test the daily chart support level.
If this level breaks and the 1,2,3 pattern gets confirmed, then all the momentum would be lower.
This would open the way for a lot of potential short trading opportunities.
4 Hour Chart

Trade Ideas Note: All views, discussions and posts in the ‘charts in focus trade ideas’ are the view of Forex School Online and are not recommendations or trading advice. All posts are general in nature and are not advice to buy or sell.
Note: We Use Correct ‘New York Close 5 Day Charts’ – You can read about why we use these and how to download the correct free charts at Correct Free New York Close Demo Charts
Please leave questions or comments in the comments section below;


Leave a Reply