Weekly Price Action Trade Ideas – 27th Oct to 1st Nov 2019
Markets Discussed in This Week’s Trade Ideas: GBPUSD, EURGBP, GOLD and OIL.
Note: We Use Correct ‘New York Close 5 Day Charts’ – You can read about why we use these and how to download the correct free charts at Correct Free New York Close Demo Charts
EURGBP Daily and 1 Hour Charts
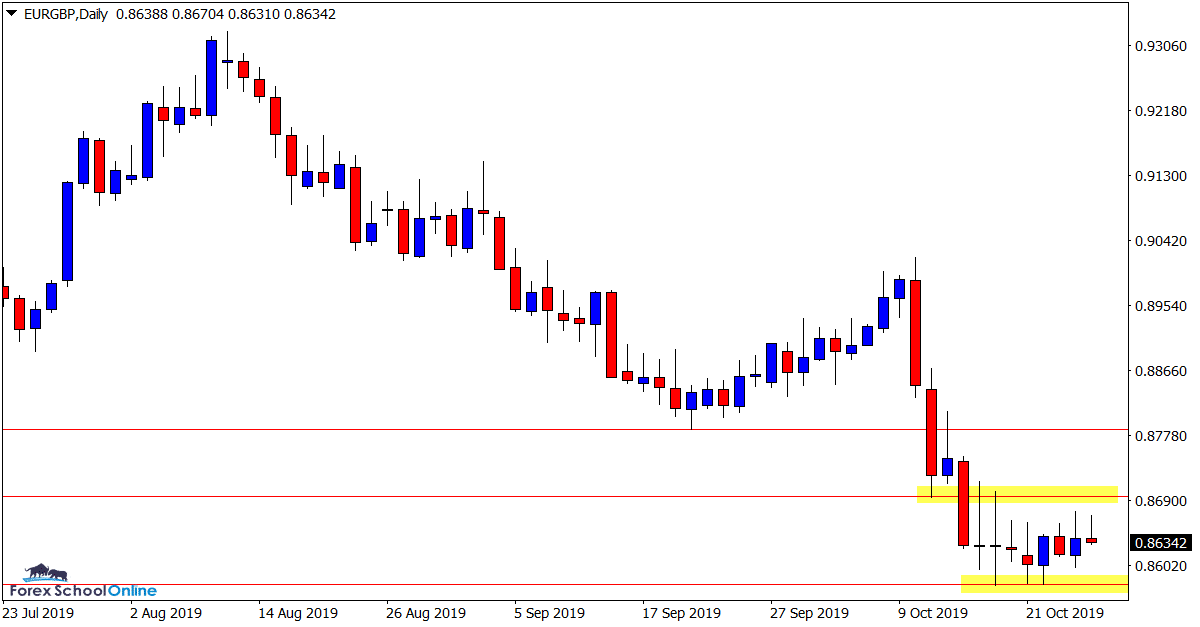
Price Consolidating After Large Move Lower
We have been watching and discussing this market in our last few trade ideas because of the clear and free flowing moves price action has been making.
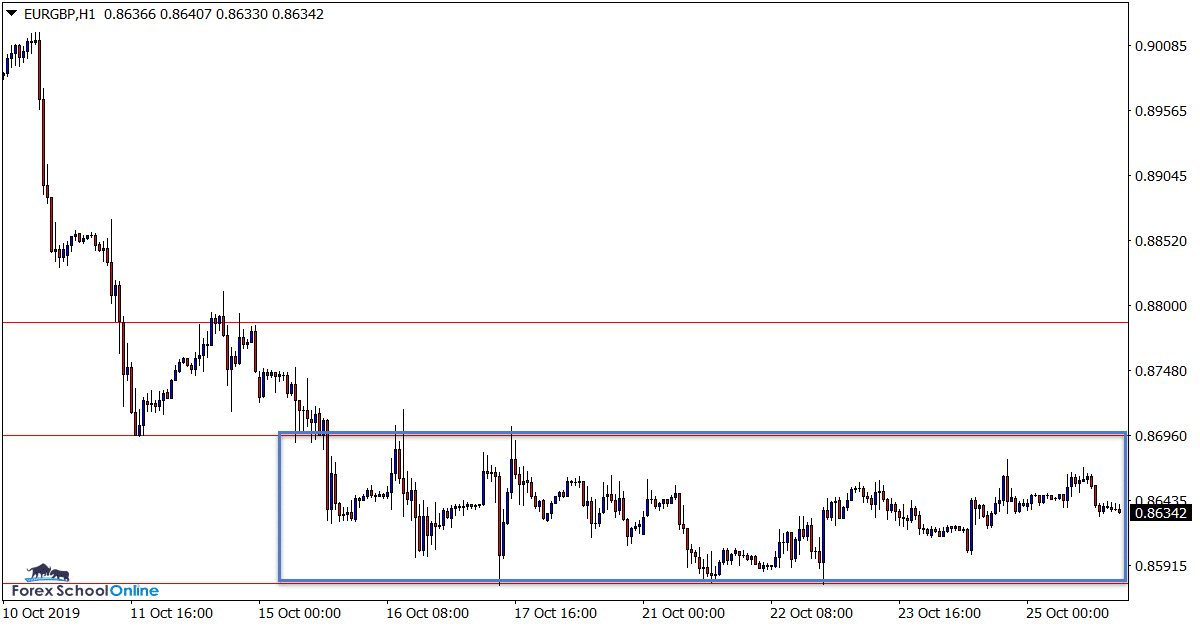
Over the last week price has stalled and moved into a consolidation phase that is quite common after such a strong move like we have seen here.
This could present with multiple trade opportunities. Intraday traders could continue to look to play the range as discussed last week on the 1 hour or smaller time frames.
Higher time frame traders could watch for price to breakout of the consolidation and potentially form a continuation breakout inline with the current momentum lower.
Daily Chart
1 Hour Chart
GBPUSD Daily Chart
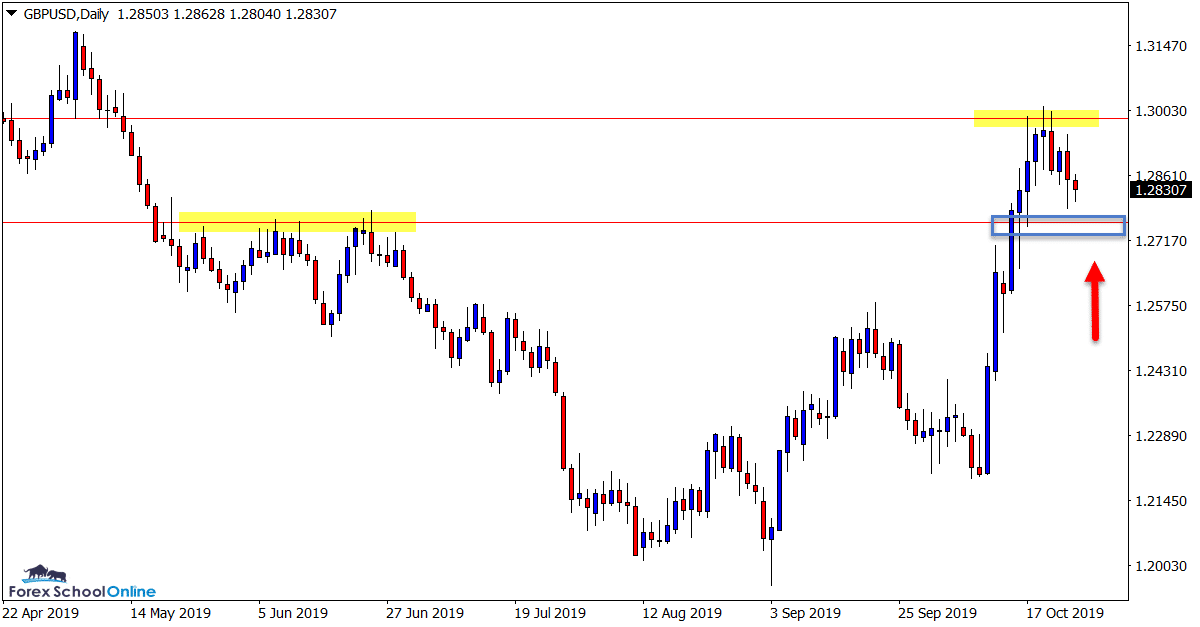
Pullback Into Potential Price Flip
After making the large and aggressive move higher, price has stalled and rejected the daily resistance level.
As the daily chart shows below; price has now rotated lower and is hovering just above the near term support level.
It would not surprise to see price consolidate after this large move higher and the support level could be a solid level to watch on smaller time frames for potential bullish price action clues.
Daily Chart
GOLD Daily Chart
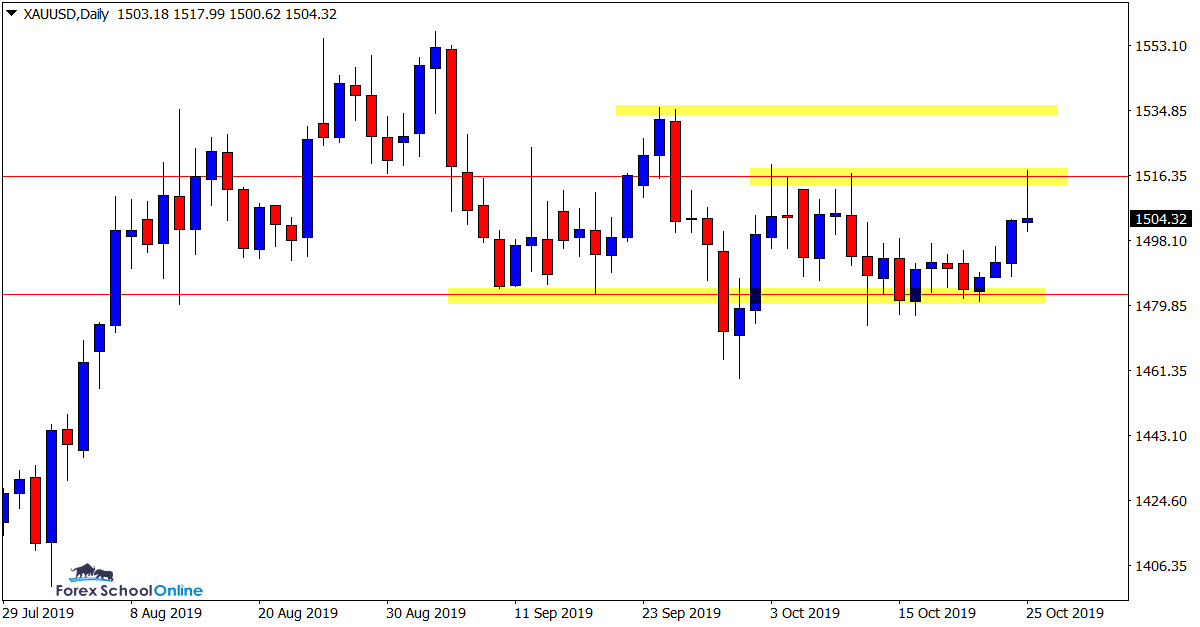
Price Finally Breaks Daily Highs
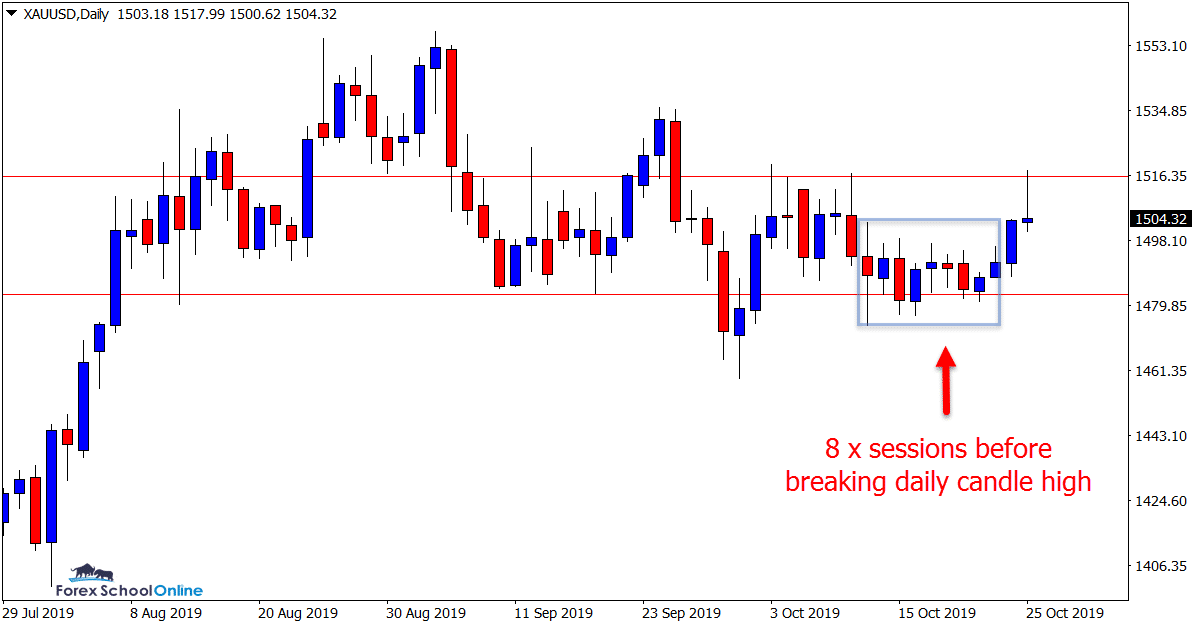
Price on the daily chart of Gold has finally made a solid move. As you can see on the chart below; price had traded within the previous daily candles range for eight sessions straight before finally breaking higher.
After price broke higher, it ran straight into the recent swing high and logical resistance area. This is an interesting one and as discussed in last week’s trade ideas this looks like it could be played both ways for the time being.
Whilst we have a rejection candle on the daily chart, if price can muster steam again and breakout we could see a fast move back into the recent extreme highs.
Daily Chart
Daily Chart
OIL v USD Daily Chart
Overhead Resistance Looks Key
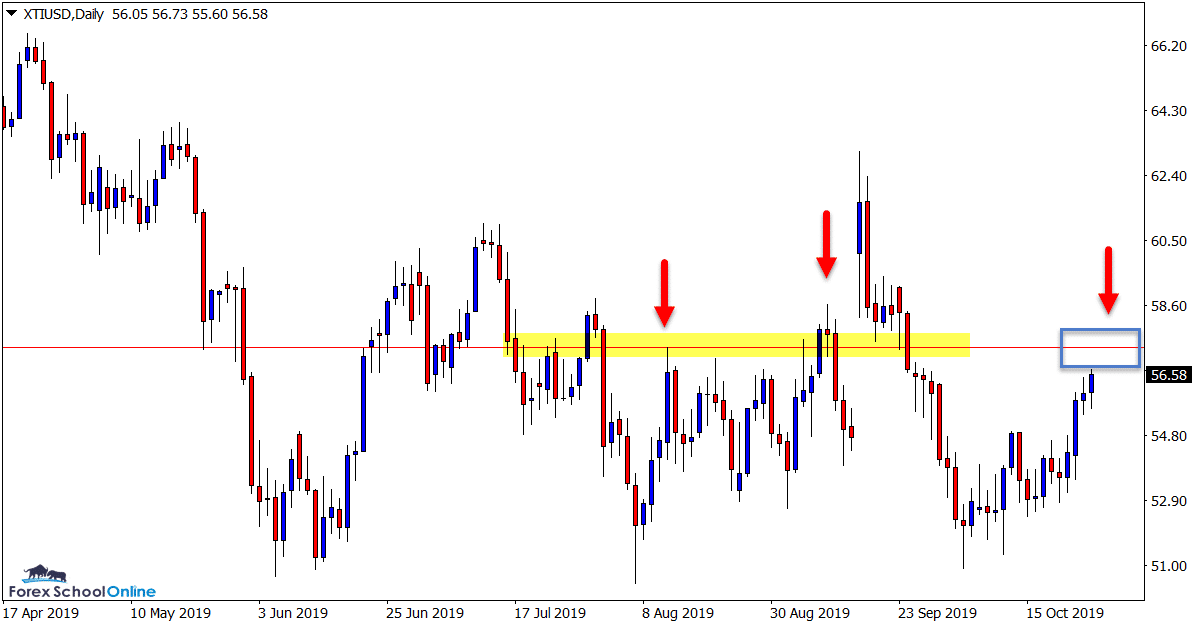
This market is in a fairly clear sideways ranging pattern at the moment on the daily chart.
After rejecting and reversing off the range lows price has now moved higher to be looking to test the key daily resistance.
This level looks a crucial level as it has held as both support and resistance in the past.
It could also be a solid level to watch for potential high probability bearish price action triggers to get short.
Daily Chart
Trade Ideas Note: All views, discussions and posts in the ‘charts in focus trade ideas’ are the view of Forex School Online and are not recommendations or trading advice. All posts are general in nature and are not advice to buy or sell.
Note: We Use Correct ‘New York Close 5 Day Charts’ – You can read about why we use these and how to download the correct free charts at Correct Free New York Close Demo Charts
Please leave questions or comments in the comments section below;


Hi Ola,
if you have not had a chance yet, check out the free beginners course here; https://www.forexschoolonline.com//forex-school-beginner-course/
Johnathon
am still a beginner coach, i really don’t understand this much
wonderful coach ,this is very good
Thanks Thabo 👍👍
Johnathon
Thanks mate👍
👍👍