Weekly Price Action Trade Ideas – 27th April to 1st May 2020
Markets Discussed in This Week’s Trade Ideas: EURUSD, AUDUSD, EURNZD and US500.
Note: We Use Correct ‘New York Close 5 Day Charts’ – You can read about why we use these and how to download the correct free charts at Correct Free New York Close Demo Charts
EURUSD Daily Chart
Major Support Tested
In last week’s trade ideas we were looking at multiple potential trading opportunities with this pair.
The major support and resistance levels that price had been trading within continue to hold at this stage and remain in play.
If price can gain momentum from the 2 bar reversal that has formed on the daily chart we could see a solid move back higher.
A failure of the support level could open the way for a large and aggressive move that could present many potential trading opportunities especially for the more aggressive breakout and intraday traders.
Daily Chart

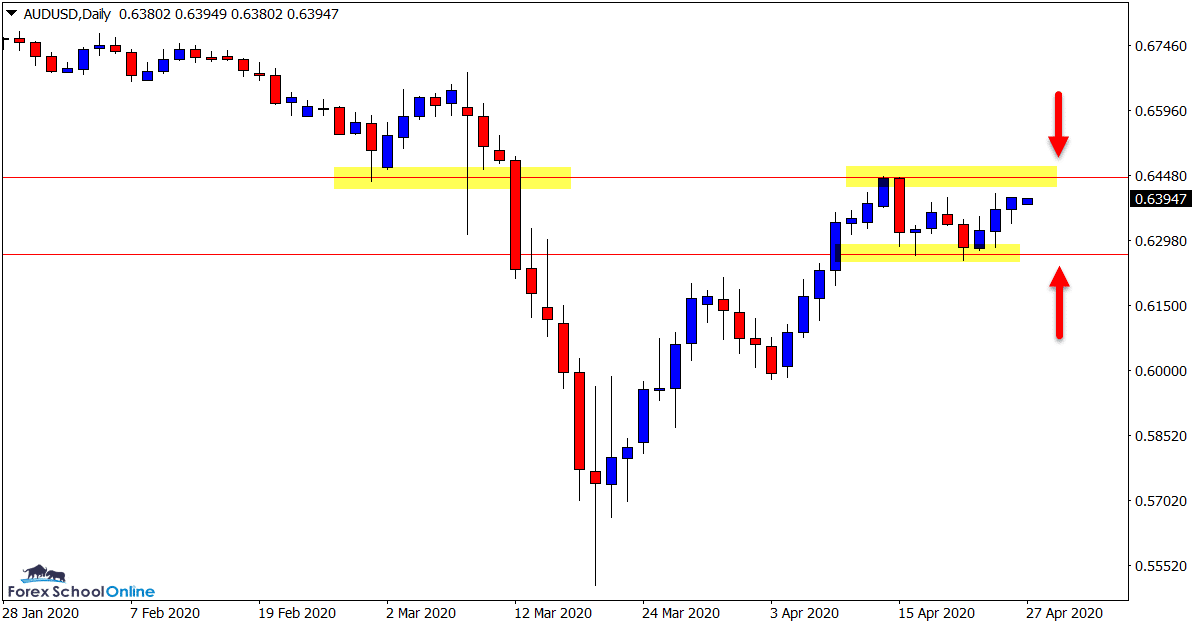
AUDUSD Daily Chart
Resistance Comes in Again
The same two levels discussed in last week’s trade ideas remain in play with this pair.
As the daily chart shows below; price is now looking to test the key resistance level.
Price in the last week mainly traded sideways. Until a clean break and clearer price action forms the best play may be to either watch for breakout trades or follow the price action clues on the smaller time frames when the resistance is tested.
Daily Chart

EURNZD Daily and 4 Hour Chart
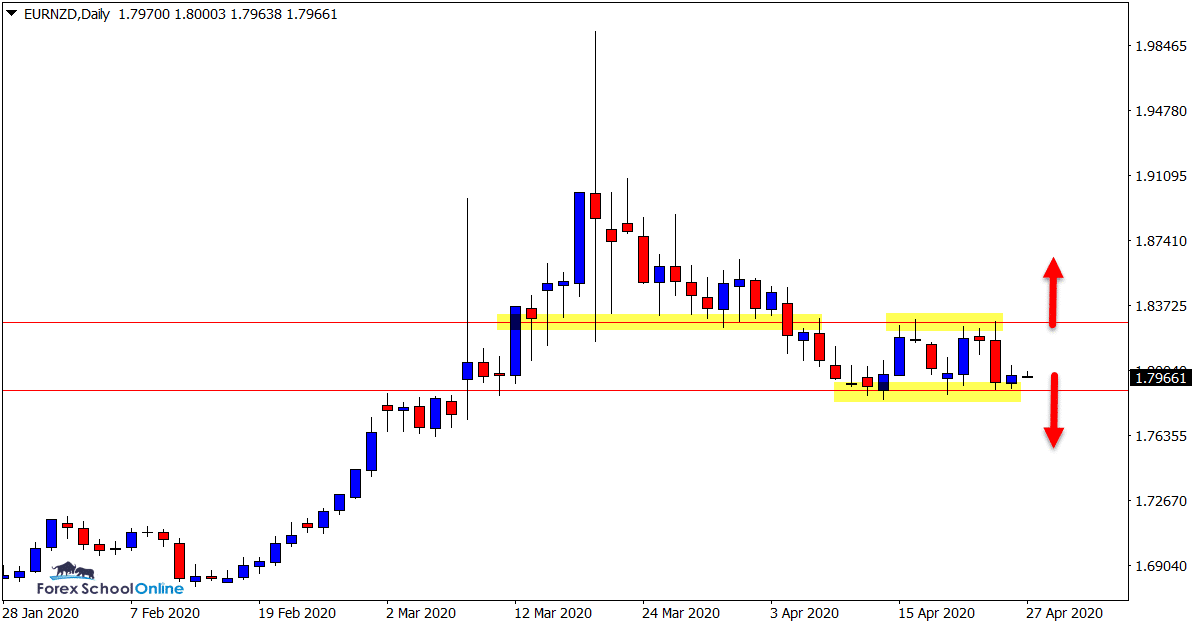
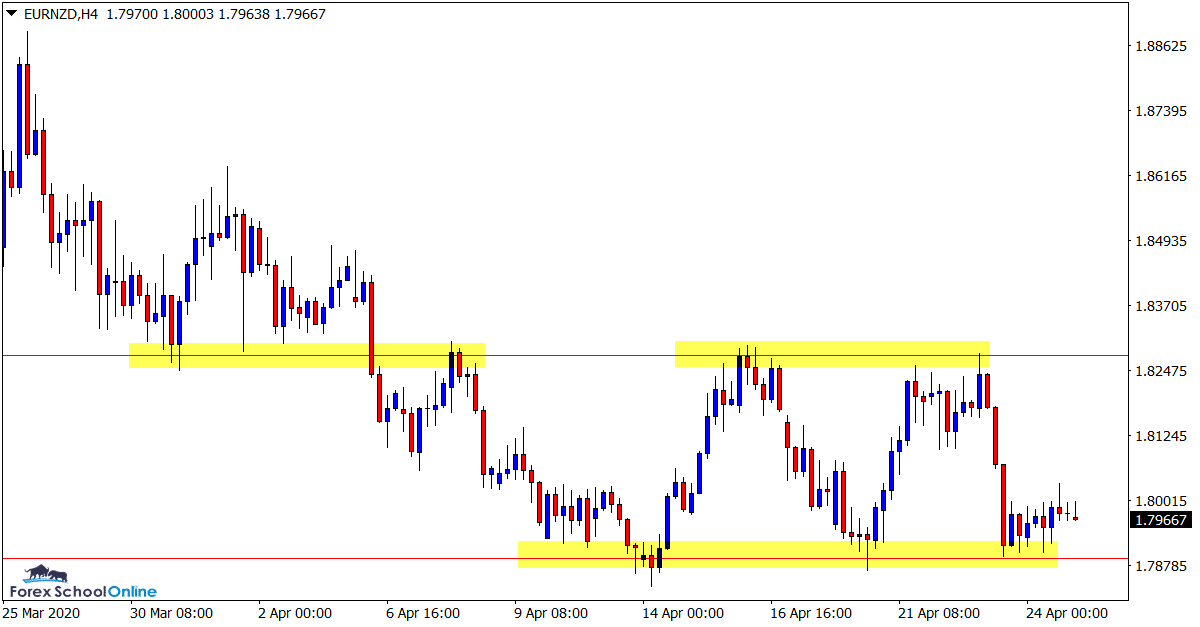
Tight Range in Play
After a huge move higher followed by a retracement lower, price is now in a fairly clear box pattern.
This box type area could present multiple trading opportunities in the coming sessions.
Similar to the EURUSD last week, range traders could look to play both sides of the market when either the high or low support and resistance levels of the box are tested.
Breakout traders could be waiting and looking for potential intraday breakout trades.
Daily Chart
4 Hour Chart
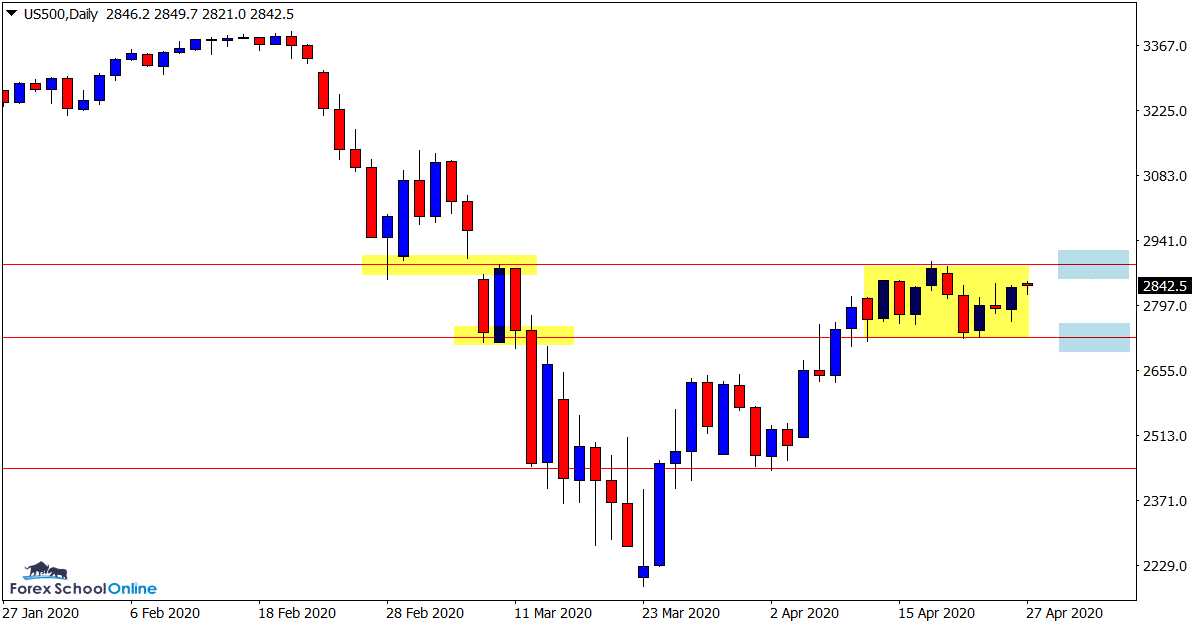
US500 Daily Chart
Price Taking a Breather
This is an interesting market.
With what is happening in the world at the moment this market has been fairly erratic in recent times similar to a lot of markets.
However; in the last week price has taken a breather and paused before making its next major move.
Price looks to be inbetween two important levels on the daily chart.
Bearish traders could be watching the major resistance for potential short trades in the coming sessions keeping in mind that for any serious move back lower the key support will need to be broken.
Daily Chart

Trade Ideas Note: All views, discussions and posts in the ‘charts in focus trade ideas’ are the view of Forex School Online and are not recommendations or trading advice. All posts are general in nature and are not advice to buy or sell.
Note: We Use Correct ‘New York Close 5 Day Charts’ – You can read about why we use these and how to download the correct free charts at Correct Free New York Close Demo Charts
Please leave questions or comments in the comments section below;


Leave a Reply