Weekly Price Action Trade Ideas – 26th to 30th of August
Markets Discussed in This Week’s Trade Ideas: AUDJPY, EURNZD, GOLD and US30.
Note: We Use Correct ‘New York Close 5 Day Charts’ – You can read about why we use these and how to download the correct free charts at Correct Free New York Close Demo Charts
AUDJPY Daily and 4 Hour Charts
Gap to Start the Week
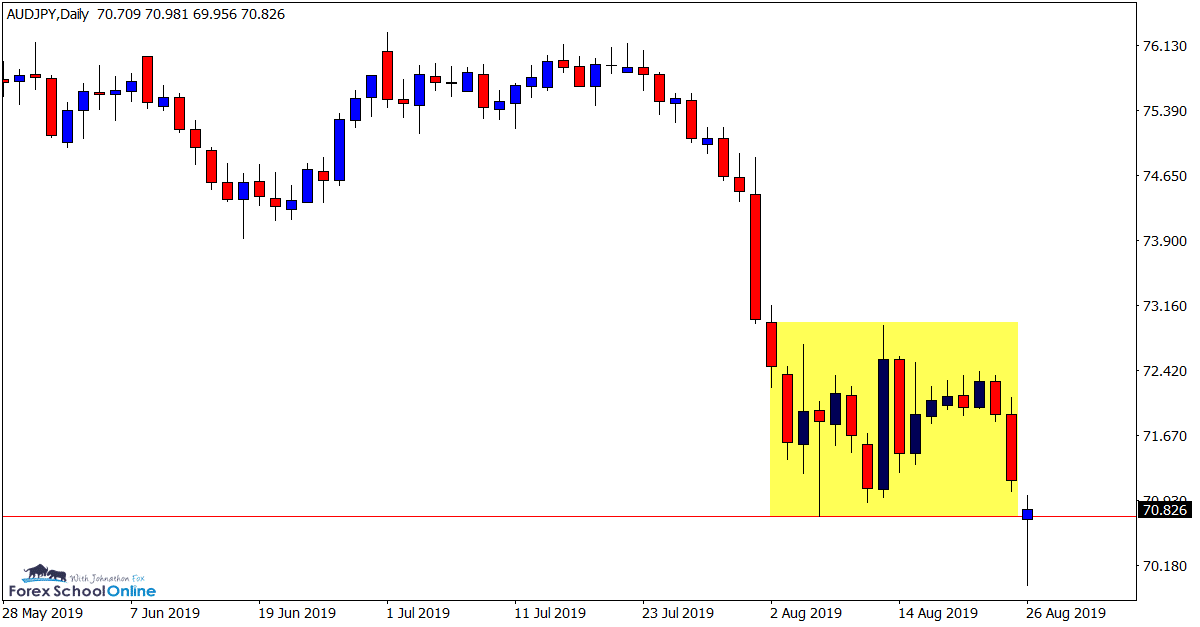
In last weeks trade ideas we discussed this market and the box that price was trading in on the daily and intraday time frames.
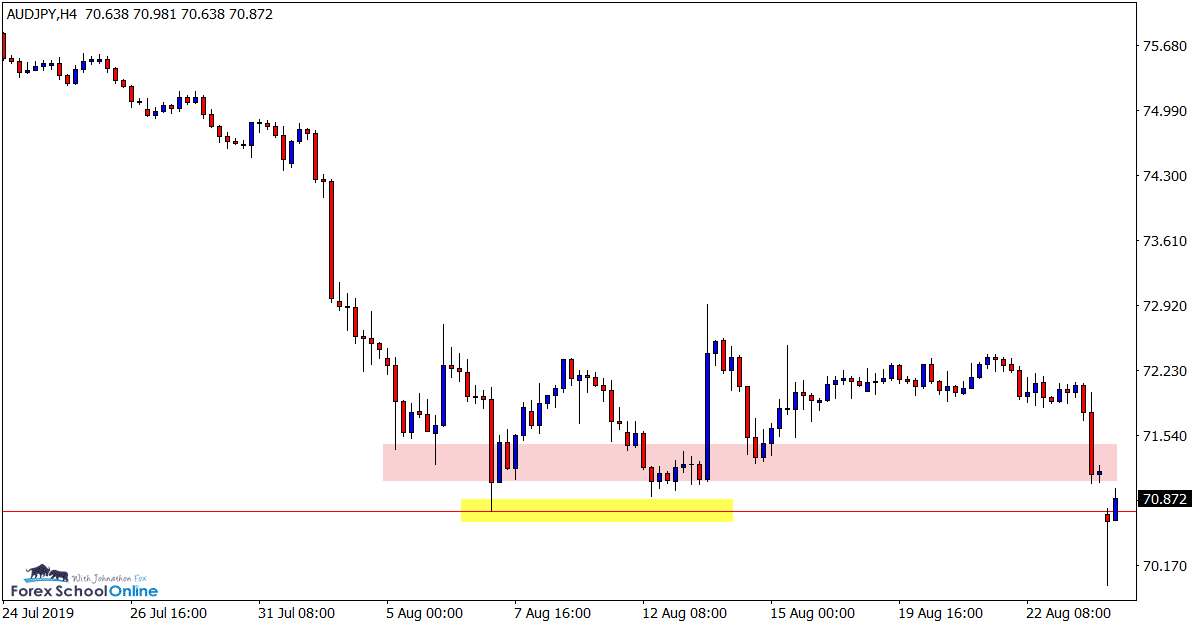
After rotating higher and into the resistance of the sideways congestion, price sold off and is now testing the support lows.
As the daily and 4 hour charts show below; price is currently looking to close the gap that was created at the start of this week’s trading.
After opening lower and moving below the support, price has quickly snapped back higher. This is an interesting market because whilst a large false break is shaping, price also has some near term resistance overhead making for a crucial short term period for this pair.
Daily Chart
4 Hour Chart
EURNZD Daily and 4 Hour Charts
Crucial Resistance Level
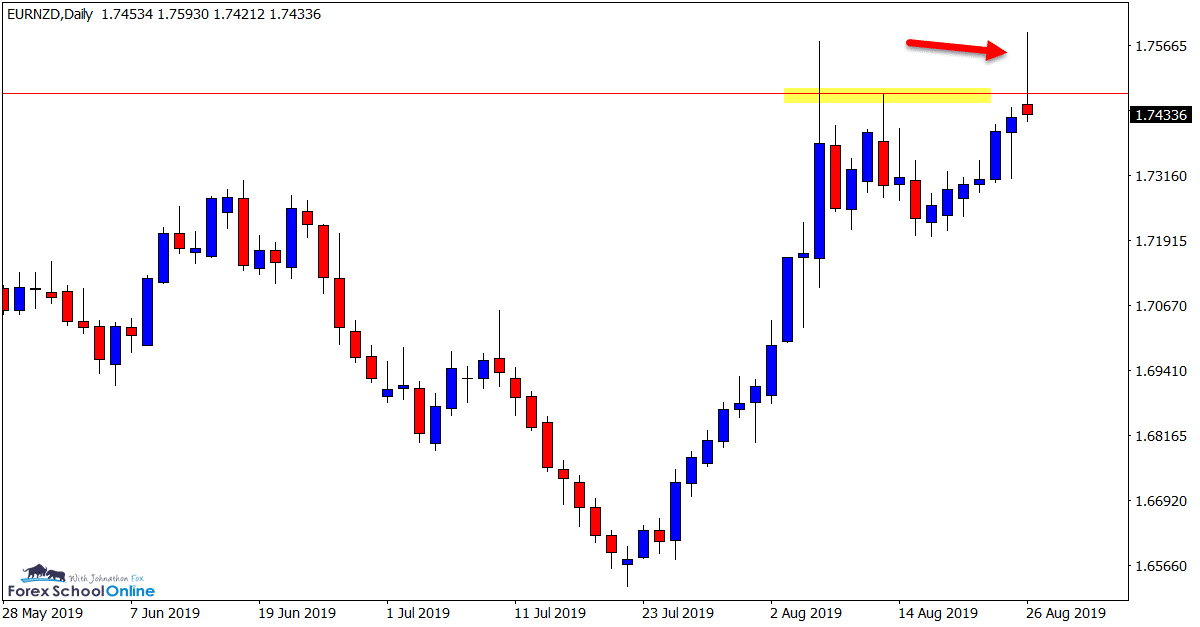
This market is very similar to the AUDJPY above, but inverted.
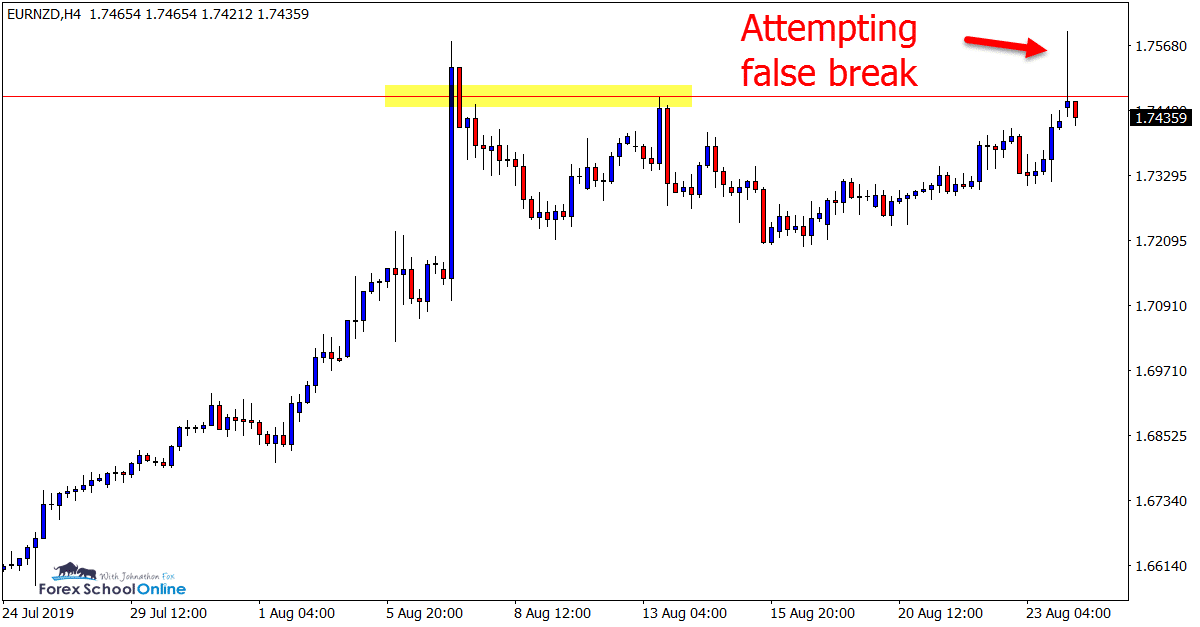
In recent times price has formed a large aggressive leg higher before running into the strong resistance it finds itself testing now.
As the 4 hour chart shows most clearly; price is looking to form a bearish false break against this recent move higher at the resistance level.
This pair has a similar issue to that of the AUDJPY in that there is some very close near term support that price would have to fall below for the false break to signal a large move lower.
If we can see a break through the major resistance, it could clear the way for the next extended bullish leg higher.
Daily Chart
4 Hour Chart
GOLD Daily and 4 Hour Charts
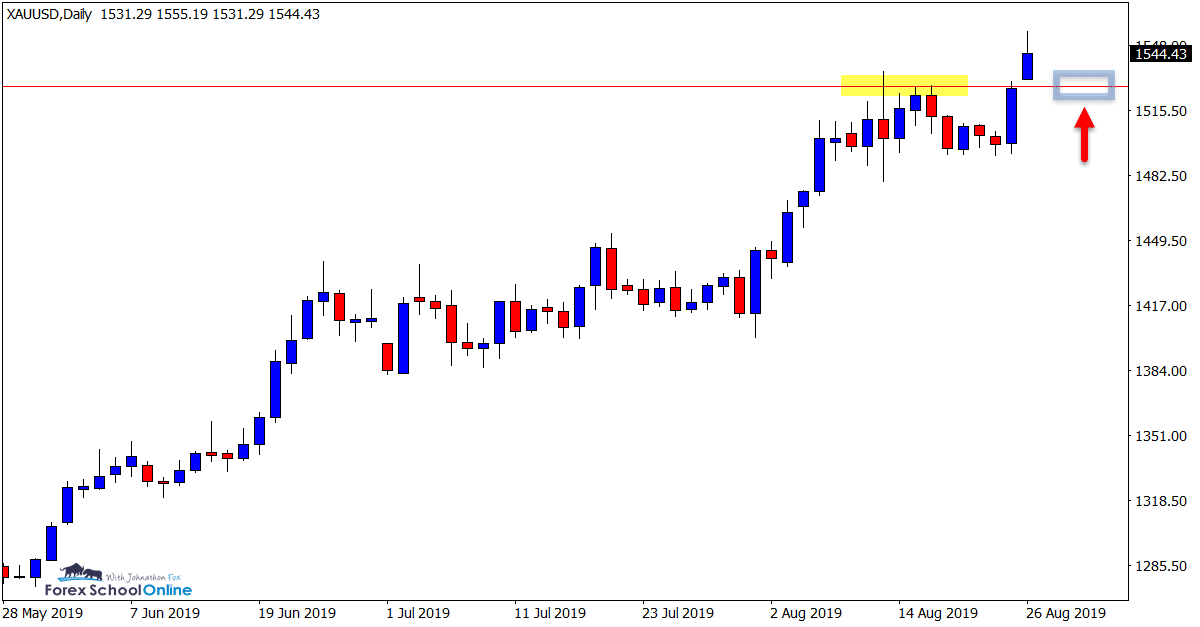
Move Higher Continues
Gold has been in a strong trend higher in recent times with price action forming a series of higher highs and higher lows.
Price is now attempting to continue this strong move higher with a breakout of the recent resistance and swing high.
If price can carry on with this break, bullish traders could look to jump into the trend on any short pullbacks into the old resistance and potential new support that could act as a price flip level for the next leg higher.
Daily Chart
4 Hour Chart
US30 Daily Chart
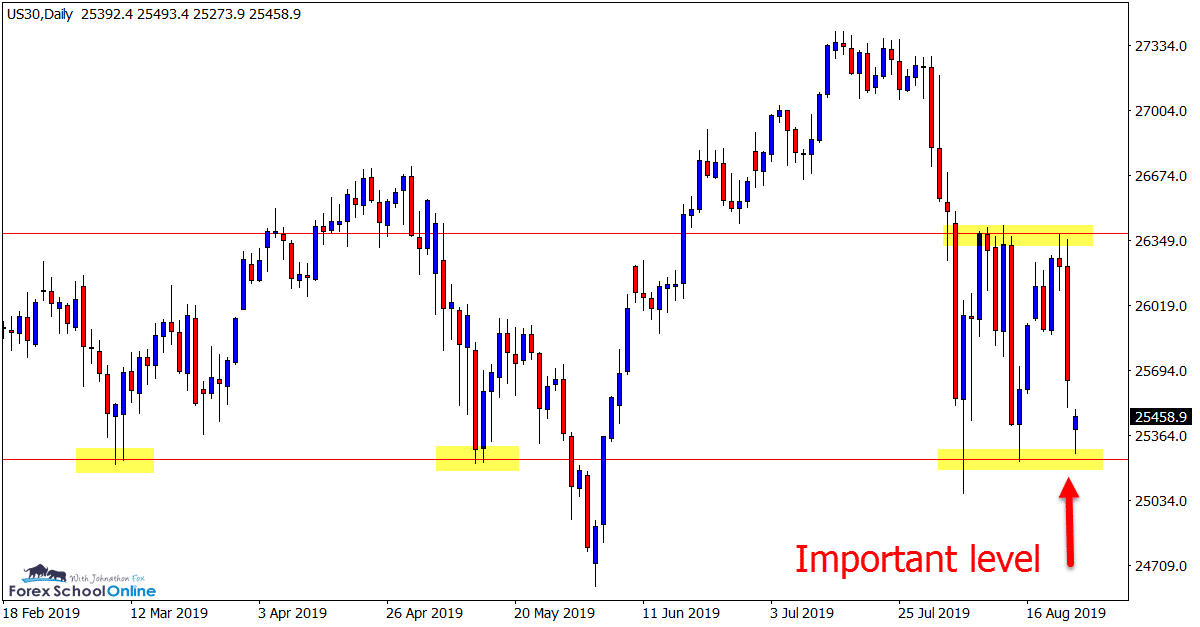
Another Aggressive Sell Off
In last week’s trade ideas we looked at this market and the fairly clear box that price had been trading between in recent times.
During last weeks trading, price moved higher and into the box resistance and once again sold off heavily to now be testing the crucial daily chart support level.
This looks to be an important level for this market and an important level to watch this week. If price breaks this level it could open the door for bearish trading opportunities such as breakout trades or breakout and quick intraday retest setups.
Daily Chart
Trade Ideas Note: All views, discussions and posts in the ‘charts in focus’ are the view of Forex School Online and are not recommendations or trading advice. All posts are general in nature and are not advice to buy or sell.
Please leave questions or comments in the comments section below;


Gold. keep buying strategy at support areas, nearest is 1525. Us30 so the sell at the upper resistance will have a higher probability